Using d3.js to modify c3.js chart
Asked Answered
F

1

0

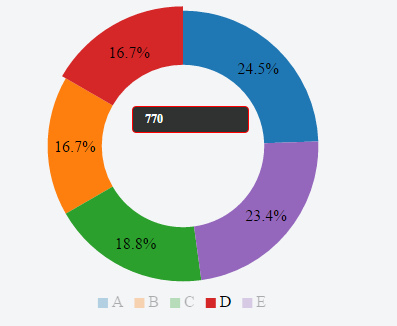
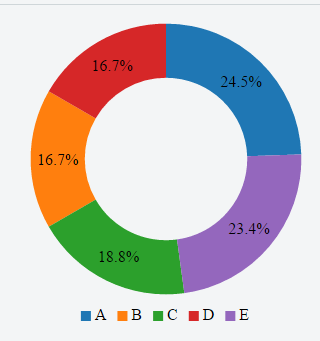
I am using C3.js to create charts. I have created a simple donut chart. Here is the screen shot: enter image description here

When I hover over the different donut slices/pieces they expand. Here is a screen shot of that happening:

enter image description here

I was wondering if it is possible to have certain donut pieces expand like that by DEFAULT without hovering over them.

Here is my FIDDLE

I was also suggested to add the following code to make the donut pieces stick out:

setTimeout( function() {
  d3.selectAll('.c3-arc-D, .c3-arc-B, .c3-arc-C').attr("transform", "scale(1.1)");       
}, 5);

However this makes the chart messy and the circle is not maintained anymore. Here is the screenshot:

enter image description here

Fellah answered 4/5, 2016 at 14:50 Comment(0)
R
1

Use the following

setTimeout(function () {
    chart.internal.expandArc(['A', 'B'])
}, 0)

Source

Note: The ideal solution would be to grab the mouseover callback and call it with your data but if you only want to expand the arcs just call the method above

var currentSlice;

var chart = c3.generate({
  bindto: '#dash',
  data: {
    x: 'x',
    columns: [
      ['x', '2013-01-01', '2013-01-02', '2013-01-03', '2013-01-04', '2013-01-05', '2013-01-06'],
      ['A', 30, 200, 100, 400, 150, 250],
      ['B', 130, 100, 140, 200, 150, 50],
      ['C', 50, 100, 130, 240, 200, 150],
      ['D', 130, 100, 140, 200, 150, 50],
      ['E', 130, 150, 200, 300, 200, 100]
    ],
    type: 'donut'
  },
  axis: {
    x: {
      type: 'timeseries',
      tick: {
        format: '%Y-%m-%d',
        centered: true,
        position: 'inner-right'
      }
    }
  },
  bar: {
    width: {
      ratio: 0.5 // this makes bar width 50% of length between ticks
    }
  },
  tooltip: {
    grouped: false,
    contents: function(data, defaultTitleFormat, defaultValueFormat, color) {
      //  console.log("Containt");
      // console.log(data, defaultTitleFormat, defaultValueFormat, color);
      return "<p style='border:1px solid red;'>" + data[0].value + "</p>";

    }
  }
});
setTimeout(function() {
  chart.internal.expandArc(['A', 'B'])
}, 0)
p {
  line-height: 1;
  font-weight: bold;
  padding: 5px 12px;
  background: rgba(0, 0, 0, 0.8);
  color: #fff;
  border-radius: 4px;
  line-height: 15px;
  font-size: 12px;
  min-width: 91px;
}
<script src="https://cdnjs.cloudflare.com/ajax/libs/d3/3.4.11/d3.min.js"></script>
<script src="https://cdnjs.cloudflare.com/ajax/libs/c3/0.4.11/c3.min.js"></script>
<link href="https://cdnjs.cloudflare.com/ajax/libs/c3/0.4.11/c3.min.css" />
<div id="dash"></div>
Reaganreagen answered 4/5, 2016 at 18:22 Comment(2)
The answer is good however there is one issue with the answer the arcs do expand but once i hover over the chart they shrink again. is there way to fix this?Fellah
@MauricioPoppe - you might need to override unexpandArc. jsfiddle.net/uamd1404 is probably one way to do it. Cheers!Twice

© 2022 - 2024 — McMap. All rights reserved.