How to show values stacked bar chart utilizing dc.js and d3.js?
Asked Answered
E

1

2

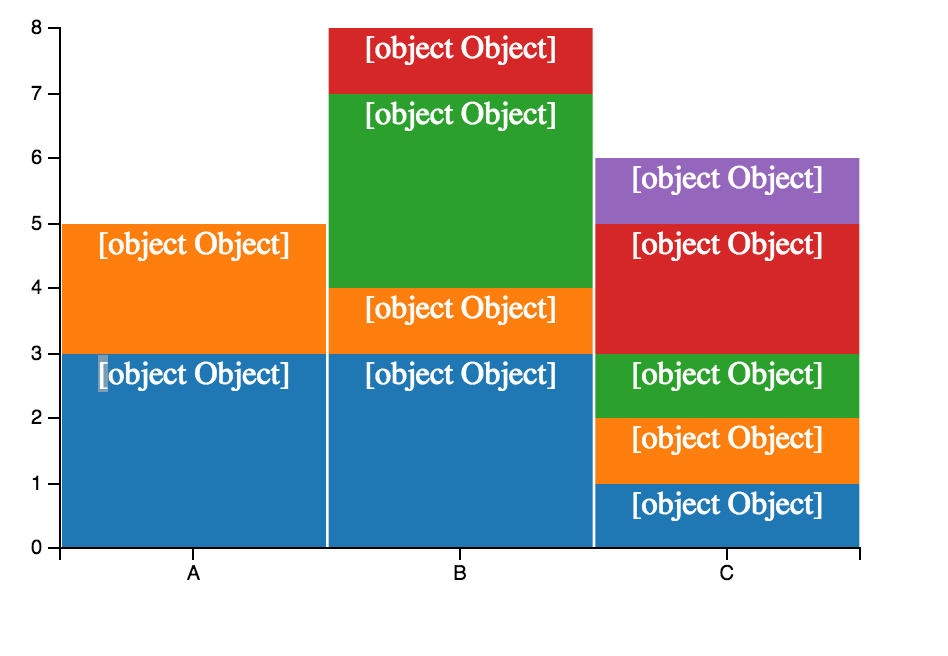
Based on this question, I was able to create a bar chart using dc.js and d3.js with labels. However, I turned the bar chart into a stacked bar chart (based on this documentation), and I'm having difficulty showing the labels for each of the stacks.

For example each stack in the below chart should show the number, but it's showing [object Object]

enter image description here

See below for code and here for codepen

Javascript

var data = [{Category: "A", ID: "1A"}, {Category: "A", ID: "1A"}, {Category: "A", ID: "1A"}, {Category: "A", ID: "2B"}, {Category: "A", ID: "2B"}, {Category: "B", ID: "1A"}, {Category: "B", ID: "1A"}, {Category: "B", ID: "1A"}, {Category: "B", ID: "2B"}, {Category: "B", ID: "3C"}, {Category: "B", ID: "3C"}, {Category: "B", ID: "3C"}, {Category: "B", ID: "4D"}, {Category: "C", ID: "1A"}, {Category: "C", ID: "2B"}, {Category: "C", ID: "3C"}, {Category: "C", ID: "4D"}, {Category: "C", ID: "4D"}, {Category: "C", ID: "5E"}];

var ndx = crossfilter(data);

var XDimension = ndx.dimension(function (d) {return d.Category;});


var YDimension = XDimension.group().reduce(
    function reduceAdd(p, d) {
      p[d.ID] = (p[d.ID]|| 0) + 1;
      return p;
    },
    function reduceRemove(p, d) {
      p[d.ID] = (p[d.ID]|| 0) -1;
      return p;
    },
    function reduceInitial() {
      return {};})


dc.barChart("#Chart")
    .width(480).height(300)
    .dimension(XDimension)
    .group(YDimension,"1A",function(d) {return d.value["1A"];})
    .stack(YDimension,"2B",function(d) {return d.value["2B"];})
    .stack(YDimension,"3C",function(d) {return d.value["3C"];})
    .stack(YDimension,"4D",function(d) {return d.value["4D"];})
    .stack(YDimension,"5E",function(d) {return d.value["5E"];})
    .transitionDuration(500)
    .xUnits(dc.units.ordinal)
    .x(d3.scale.ordinal().domain(XDimension))
    .renderlet(function (chart) {

    //Check if labels exist
    var gLabels = chart.select(".labels");
    if (gLabels.empty()){
        gLabels = chart.select(".chart-body").append('g').classed('labels', true);
    }

    var gLabelsData = gLabels.selectAll("text").data(chart.selectAll(".bar")[0]);

    gLabelsData.exit().remove(); //Remove unused elements

    gLabelsData.enter().append("text") //Add new elements

    gLabelsData
    .attr('text-anchor', 'middle')
    .attr('fill', 'white')
    .text(function(d){
        text_object =  d3.select(d).data()[0].data.value
        return text_object
    })
    .attr('x', function(d){ 
        return +d.getAttribute('x') + (d.getAttribute('width')/2); 
    })
    .attr('y', function(d){ return +d.getAttribute('y') + 15; })
    .attr('style', function(d){
        if (+d.getAttribute('height') < 18) return "display:none";
    });

})


dc.renderAll();

HTML

<script src="https://ajax.googleapis.com/ajax/libs/jquery/1.12.4/jquery.min.js"></script>
<script src="https://maxcdn.bootstrapcdn.com/bootstrap/3.3.1/js/bootstrap.min.js"></script>
<link rel="stylesheet" type="text/css" href="https://cdnjs.cloudflare.com/ajax/libs/dc/1.7.0/dc.css" media="screen">
<script src="https://cdnjs.cloudflare.com/ajax/libs/d3/3.5.17/d3.js"></script>
<script src="https://rawgithub.com/NickQiZhu/dc.js/master/web/js/crossfilter.js"></script>
<script src="https://cdnjs.site44.com/dc3.js"></script>
<script src="https://rawgithub.com/NickQiZhu/dc.js/master/web/js/crossfilter.js"></script>
<script src="https://d3js.org/d3.v3.min.js"></script>
<body>
    <div id='Chart'></div>
</body>
Etheleneethelin answered 19/9, 2016 at 20:50 Comment(4)
I don't get what the difference is between this question and the other one - please close one or the other. stackoverflow.com/q/39580578/676195Dysteleology
I don't recommend using the code from the first part of the answer to the question you've linked - it's not idiomatic d3 code and it's hard to troubleshoot. If you instead you use the second code provided by @dimirc, it shows labels for all the stacks. Incidentally, renderLabel is now implemented for bar charts - but it only draws a label for the top bar. If you care to contribute to dc.js, you could add an option to draw labels for all bars.Dysteleology
Fork of your codepen using the other code, showing labels for all stacks: codepen.io/gordonwoodhull/pen/xERGVE?editors=1010Dysteleology
@gordon - Thanks for your feedback. The two questions were similar, so I merged the two questions here, deleted the other one, and made an update based on your codepen here. However, the values are still not showing in my stacked bar chart: codepen.io/chriscruz/pen/vXyggP?editors=0010Etheleneethelin
D
4

Typically what I do in these situations is put a breakpoint on the line in question and poke around and see if the object contains the data that I want somewhere else.

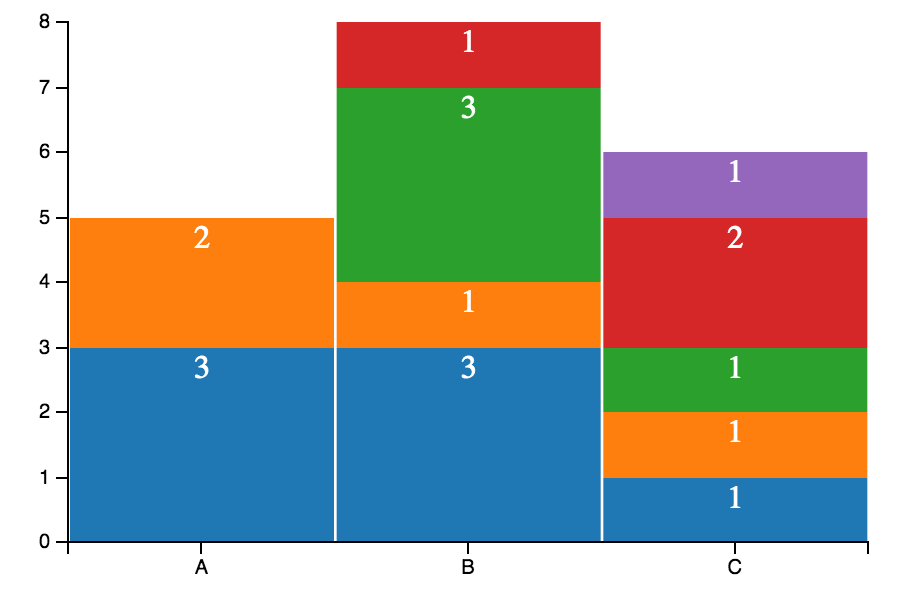
It looks like you can use .datum().y here:

    text_object =  d3.select(d).datum().y

http://codepen.io/gordonwoodhull/pen/EgNvNr?editors=1010

enter image description here

This is still kind of weird code (using DOM elements as data for a data join for some other elements is pretty hacky) but hopefully this will get you moving.

Dysteleology answered 20/9, 2016 at 22:50 Comment(13)
Thanks so much, as I spent hours trying to figure this out! This definitely got me moving! Thanks again.Etheleneethelin
Can you tell what's syntax for showing value text on dc js line plot? jsfiddle.net/elangobharathi/Lqbcye5u/5 <-- this is in d3.js .Lakenyalaker
Hi @Pygirl, I am confused because the renderLabel feature has existed for both line and bar charts for a long, long time. So I'm not clear why there was a question about it in 2016. Here's a [email protected] fiddle and here is a [email protected] fiddle demonstrating the feature for line charts.Dysteleology
But I don't know why I aint getting the label when I even use renderLabel. #60925303 I applied it on it but still the same.Lakenyalaker
I tried all the solution but it didn't work but when put the code with some minor modication on jsfiddle it's seems to work. But not working in my laptop.Lakenyalaker
jsfiddle.net/Lhc68emf <-------- Working here but not in my laptop :/ even it's showing me downward lineLakenyalaker
Yes, I saw your other question and hope to take a look today. I don't understand why labels would work on one machine but not another, sorry. SVG is usually pretty stable if you are using a current browser.Dysteleology
Is it because of crossfilters, dc, d3 js files I copied the code and put it inside a file then called it via script. because giving the link it was giving me error (loading file failed).Lakenyalaker
I thought you meant that the fiddle worked in one place but not another, which I have seen only rarely. If you're copying files and setting up different configurations, then, well, probably something changed. :) Not sure how I can help with that.Dysteleology
I made it to work by copying all the required file from jfiddle to my desktop and run it the same piece of code it's working but now the issue is I ain't to load my csv file. d3.csv(.............. is not working for me now.Lakenyalaker
@Pygirl, it looks like some of your code is d3@3 and some is d3@5. This could explain d3.csv not working, since the function has moved to a Promise-based API.Dysteleology
Thanks for that made it to work. Can you tell me how can I change the xaxis of this graph since I am having crossfilters when I select on some other chart this chart should be rendered decreasing way xaxis labels should also change. I am looking for a function for that.Lakenyalaker
I think this is the question you have already asked and linked above.Dysteleology

© 2022 - 2024 — McMap. All rights reserved.