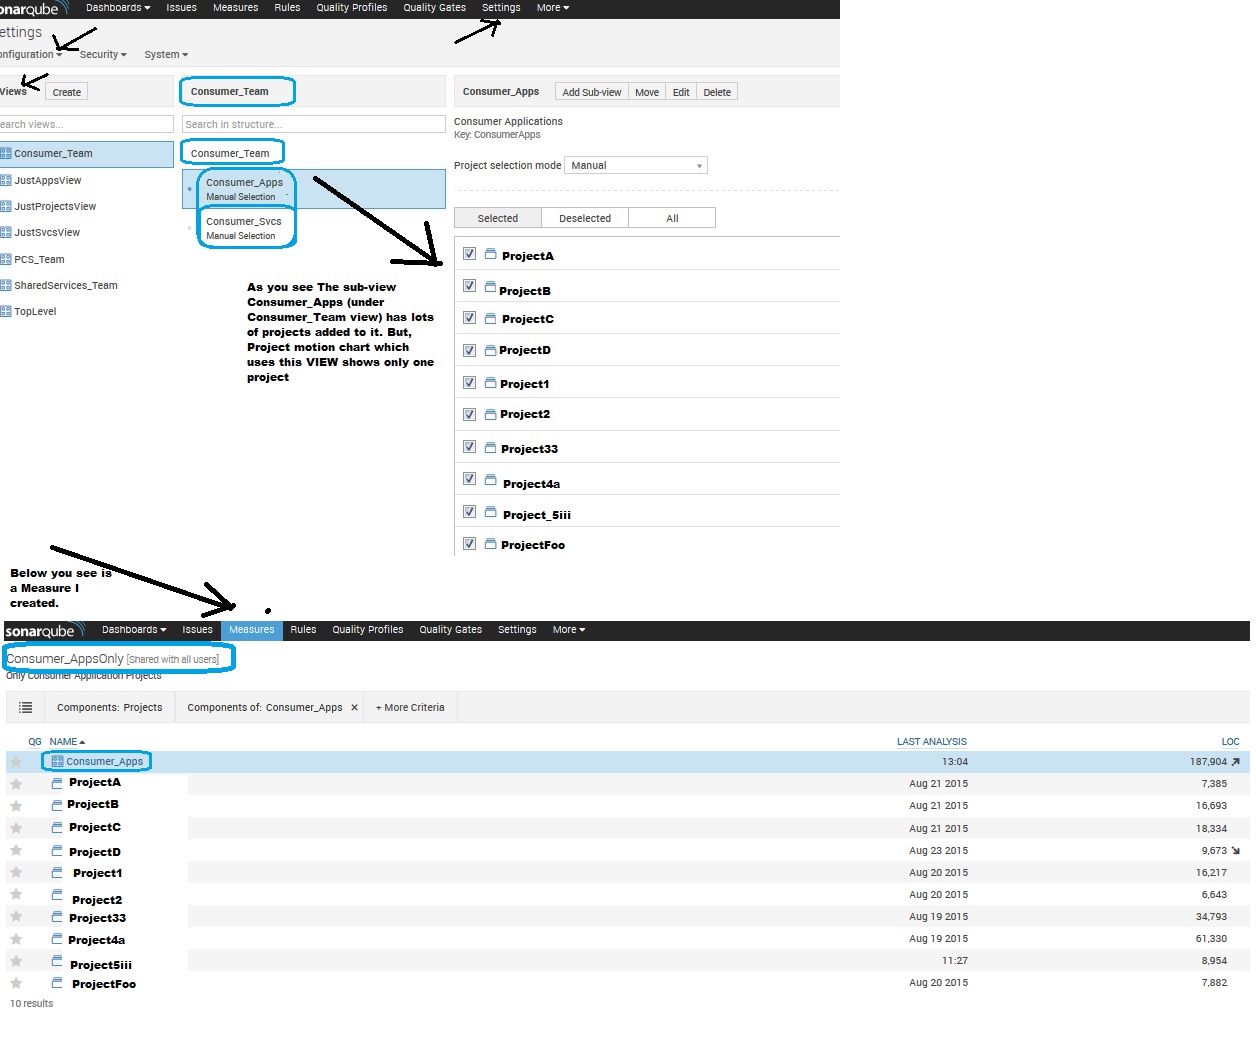
I completed a POC on View Portfolio plugin using SonarQube (5.1.x)/latest version. Got my trial license for Views Portfolio plugin and created few custom VIEWS, Sub-Views and various Measures.
Created custom/shared Dashboards which have various widgets utilizing these views/sub-views / measures that I created above. Everything is working as expected as far as Views Portfolio Plugin or Sonar Qube is concerned.
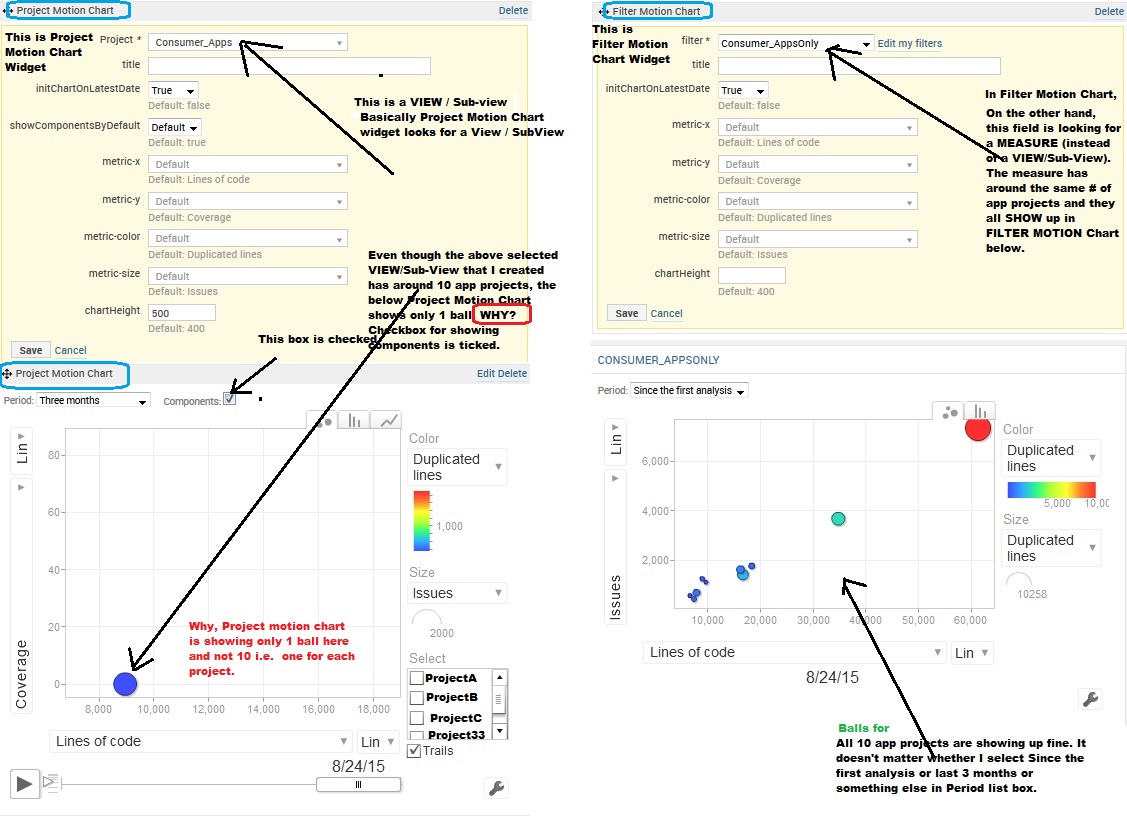
Though I'm bumped by this one issue which is coming in "Project Motion Chart" Widget (we use widgets Dashboards to show meaningful metrics about projects / views (which treats projects as components), see Views Portfolio Management plugin's docs for more info).
Can you tell why Project Motion chart widget is showing only 1 ball ?
Another similar widget is: "Filter Motion Chart" widget which is working as expected.
See the images to see the current setup / # of projects in the custom View/Sub-View and measure that I have created.
and when I use Views/Sub-View and Measure in the custom Dashboard I created using Project / Filter motion Chart widgets, I see this:


