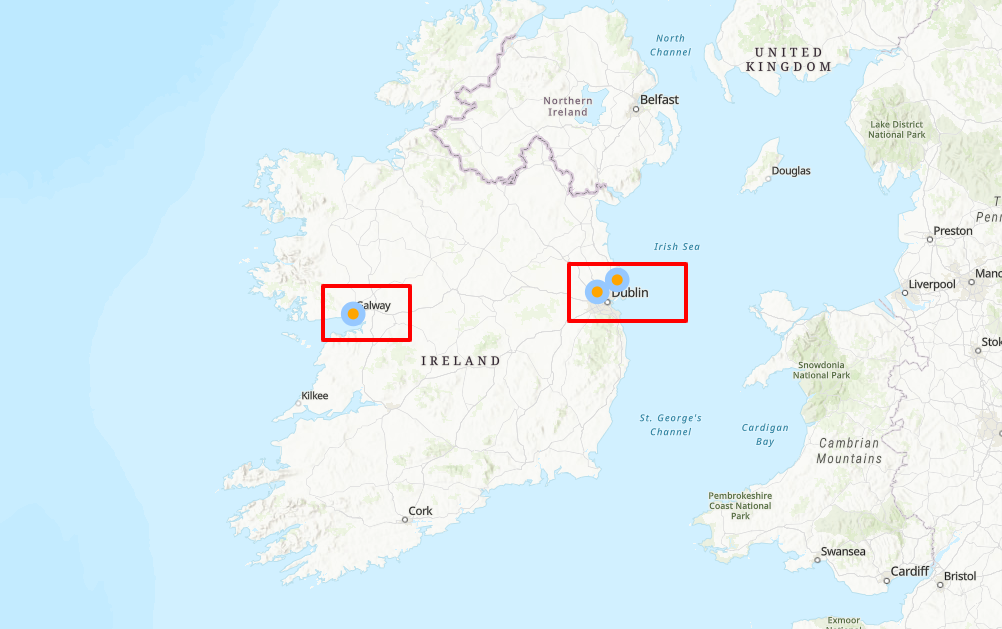
Here below is my next JS Code which is showing a simple ArcGIS map with the points or markers on the specific coordinates.
Can anyone please let me know that how can I display the popup / Info window for the points on the map? e.g. I click on any point and it will open a corresponding popup on it.
import NavBar from '@/components/NavBar'
import axios from 'axios';
import { useRef, useEffect, useState } from 'react';
import { loadModules } from 'esri-loader';

export default function Home({...props}) {
    const [state, setState] = useState('');
    const MapElement = useRef(null)
    const options = {
     url: 'https://js.arcgis.com/4.6/',
     css: true
    };

    useEffect(() => {
        var vehicleData = props.data
        var map, point_symbol;
        loadModules([
            "esri/views/MapView",
            "esri/WebMap",
            "esri/Graphic",
            "esri/geometry/Point",
            "esri/PopupTemplate",
            "esri/layers/FeatureLayer","dojo/domReady!"
        ],options).then(([ MapView, WebMap, Graphic, Point, PopupTemplate, FeatureLayer]) => {
            const webmap = new WebMap({
                basemap: "gray-vector"
            })

            var map = new MapView({
                map: webmap,
                center:[-6.357768833333333,  53.415487166666665],
                zoom:6,
                container: MapElement.current
            })

            map.popup.autoOpenEnabled = false;

            for(var i=0, i_length=vehicleData.length; i<i_length; i++){
                point_symbol = new Point({
                    longitude:vehicleData[i].longitude,
                    latitude: vehicleData[i].latitude,
                    spatialReference: { wkid: 3857 }
                })

                var template = new PopupTemplate({
                    title: vehicleData[i].company,
                    content: vehicleData[i].description
                });

                var graphic_symbol = new Graphic({
                    geometry: point_symbol,
                    symbol: {
                        type: "simple-marker",
                        style: "circle",
                        color: "orange",
                        size: "18px",
                        outline: {
                            color: [150, 200, 255],
                            width: 5
                        }
                    },
                    popupTemplate: template
                });
                map.graphics.add(graphic_symbol)
            }


            map.on("click", function(event) {
                map.popup.open({
                  location: event.mapPoint,

                  features: [graphic_symbol]
                });
              });


            // map.on("click", function(event) {
            //     console.log(vehicleData)
            //     map.popup.open({
            //         location: event.mapPoint,  // location of the click on the view
            //         title: "You clicked here",  // title displayed in the popup
            //         content: "Your description here"  // content displayed in the popup
            //     });
            // });
        })

        return () => {
            if(!!map) {
                map.destroy()
                map=null
            }
        }
    })

    return (

        <div id="home-container">

        <NavBar />

            <div className="app-wrapper" >
                <div className="app-content">
                    <div className="no-padding">
                        <div className="row gy-4">
                            <div className="col-12">
                                <div style={{height:1000, width:1400}} ref={MapElement}></div>
                            </div>
                        </div>
                    </div>
                </div>
            </div>

        </div>
    )
}

export async function getServerSideProps(context) {

    let response = await axios(process.env.BASE_URL +'/devices/all',{
        headers : {
            'Authorization' : 'Bearer ' + process.env.TOKEN
        }
    })

    let data = await response.data
    return {
        props : {
            data: data
        }
    }
}
I need to display pop-up or info window corresponding to each markup multiple circles on the map. In the above code, API call is done by getServerSideProps, and data as an array of objects is passed to the component using props.
I am able to display multiple circles on the map but don't know how to display info window corresponding to each marker?


document.body, you can use them to position info-windows absolutely, with cssposition: absolute. But as I see, your circles are geometries, thus their coordinates are relative to some canvas. So you need to get the coordinates of those circles (or precisely, circle centers) relative to that canvas (don't confuse them with geo-coordinates) and use coordinates of the canvas relative to document.body to find out coordinates of those points relative to document.body. Sounds complex, but it's so )) – Doorstopesrilibrary. And I don't have a sample of points data you requesting from ...+'/devices/all'. – Doorstopnew MapView({... center:[...], zoom:...}). And there should be some event, fired byesrisystem, in case center and zoom changed due to user actions, so you can recalculate to get new (x,y) coordinates and update window positions accordingly – Doorstop