http://plnkr.co/edit/ymrqIOGTBqF6TVMTvC4T?p=preview
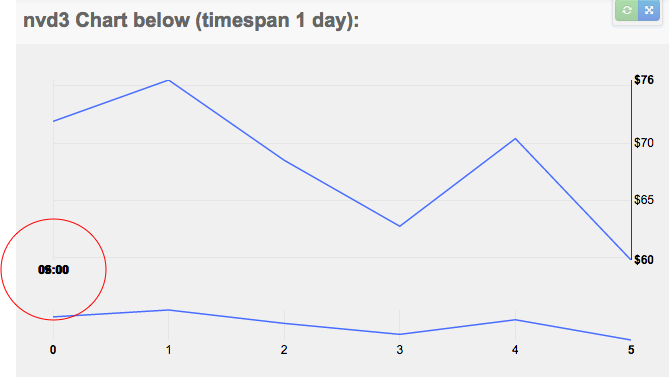
I have the latest d3 and nvd3 libraries in the plnkr above. When you first view the chart, you will notice that all the timespan ticks 09:00, 08:30, 08:00 etc are all squished/overlaid on top of each other on the left xAxis.
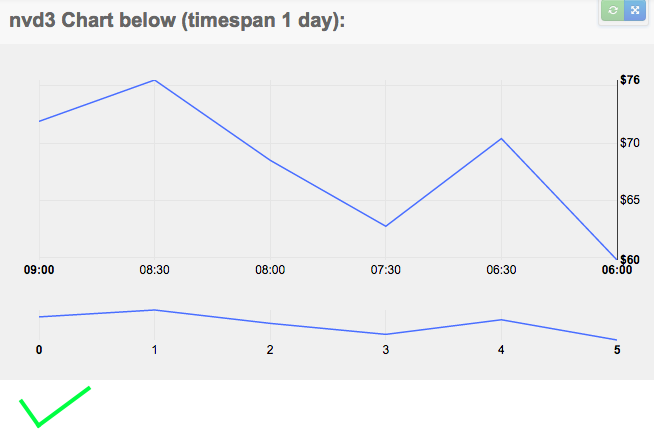
Now the timespans will not correctly stretch the length of the chart until the user either clicks on the time range finder below the chart, or resizes the window.
Currently the chart looks like this on first load:
When it should looks like this:
Any idea where I'm going wrong? I found this question here NVD3 Set Expanded as default however the answer did not work for me.
My nv.addGraph code
var data =[{
    "key" : "Price",
    "color" : "#4C73FF",
    "values" : [ [ 1443621600000 , 71.89],
                 [ 1443619800000 , 75.51],
                 [ 1443618000000 , 68.49],
                 [ 1443616200000 , 62.72],
                 [ 1443612600000 , 70.39],
                 [ 1443610800000 , 59.77]]
}];

nv.addGraph(function() {
      var chart = nv.models.linePlusBarChart()
          .margin({top: 20, right: 40, bottom: 50, left: 40})
          .x(function(d,i) { return i })
          .y(function(d) { return d[1] })
          .color(d3.scale.category10().range());

      chart.xAxis.tickFormat(function(d) {
          var dx = data[0].values[d] && data[0].values[d][0] || 0;
          // return time in hours:
          return d3.time.format('%I:%M')(new Date(dx))
      });

      chart.y1Axis
          .tickFormat(d3.format(',f'));

      chart.y2Axis
          .tickFormat(function(d) { return '$' + d3.format(',f')(d) });

      chart.bars.forceY([0]);
      chart.lines.interactive(false);
      chart.height(300);
      chart.noData("There is no Data to display at the moment.");

      // Remove legend:
      chart.showLegend(false);

      d3.select('#chart svg')
          .datum(data)
          .transition().duration(500)
          .call(chart);

      nv.utils.windowResize(chart.update);

      return chart;
  });


nv.utils.windowResize(chart.update);is not completely useless, you will need it if you need your charts to respond for window resize. – Nudibranch