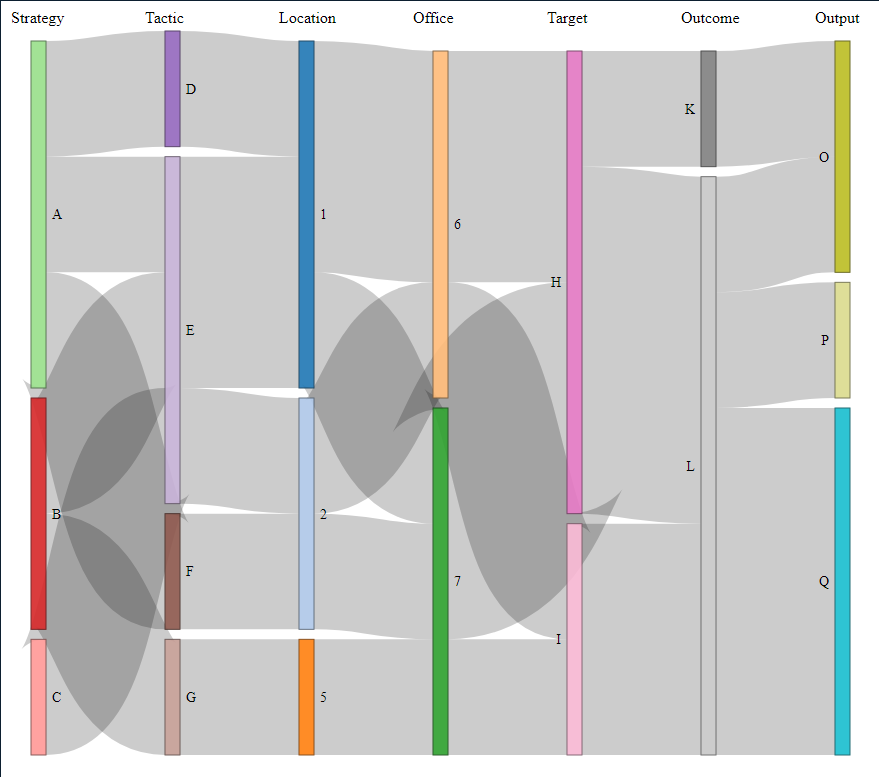
I am trying to label the x-nodes of a Sankey plot created with networkD3.
I see a solution posted here: How to add columnn titles in a Sankey chart networkD3
When I try to set labels manually, however, they show in the wrong order. I posted this as a comment in that question, but was asked to create a new question.
Here it is with a reproducible example:
    library('tidyverse')
    library('networkD3')

    #create the dataframe
    df <- data.frame('location' = c('A', 'B', 'C', 'A', 'A', 'B'),
                     'office' = c('D', 'E', 'E', 'E', 'F', 'G'),
                     'strategy' = c('1', '2', '1', '1', '2', '5'),
                     'tactic' = c('6', '6', '6', '7', '7', '7'),
                     'target' = c('H', 'H', 'I', 'H', 'H', 'I'),
                     'outcome' = c('K', 'L', 'L', 'L', 'L', 'L'),
                     'output' = c('O', 'O', 'P', 'Q', 'Q', 'Q'))

    #prepare the data for Sankey using dplyr
    #Create the links
    links <- df %>%
        mutate(row = row_number()) %>%
        pivot_longer(-row, names_to = "col", values_to = "source") %>%
        mutate(col = match(col, names(df))) %>%
        mutate(source = paste0(source, '_', col)) %>%
        group_by(row) %>%
        mutate(target = lead(source, order_by = col)) %>%
        ungroup() %>%
        filter(!is.na(target)) %>%
        group_by(source, target) %>%
        summarise(value = n(), .groups = "drop")

    #Create the nodes
    nodes <- data.frame(id = unique(c(links$source, links$target)),
                 stringsAsFactors = F) %>%
        mutate(name = sub('_[0-9]*$', '', id))

    #Create the source and target ID
    links$source_id = match(links$source, nodes$id) - 1
    links$target_id = match(links$target, nodes$id) - 1


    #Create the plot
    plot <- sankeyNetwork(Links = links, Nodes = nodes,
                  Source = 'source_id', Target = 'target_id', Value = 'value', NodeID = 'name',
                  fontSize = 14)

    #Apply the manual var labels - solution from the linked stackoverflow answer
    htmlwidgets::onRender(plot, '
      function(el) {
        var cols_x = this.sankey.nodes().map(d => d.x).filter((v, i, a) => a.indexOf(v) === i);
        var labels = ["Location", "Office", "Strategy", "Tactic", "Target", "Outcome", "Output"];
        cols_x.forEach((d, i) => {
          d3.select(el).select("svg")
            .append("text")
            .attr("x", d)
            .attr("y", 12)
            .text(labels[i]);
        })
      }
    ')
Gives:
Here you can see that:
Node 1 ('Strategy') should be 'Location'
Node 2 ('Tactic') should be 'Office'
Node 3 ('Location') should be 'Strategy'
Node 4 ('Office') should be 'Tactic'
Node 5 ('Target') is 'Target'
Node 6 ('Outcome') is 'Outcome'
Node 7 ('Output') is 'Output'
Its not clear how these are being ordered.
How can I get them in the correct order?

