I am trying to iterate over a pandas dataframe to plot multiple geolocations on a Folium map using custom icons as markers instead of the default one.
First I create a pandas dataframe as follows:
# dependencies
import folium
import pandas as pd

from google.colab import drive
drive.mount('/content/drive/')

    # create dummy data
    df = {'Lat': [22.50, 63.21, -13.21, 33.46],
                'Lon': [43.91, -22.22, 77.11, 22.11],
                'Color': ['red', 'yellow', 'orange', 'blue']
              }

# create dataframe
data = pd.DataFrame(df)
I then create a world map with a zoom factor of 2:
world = folium.Map(
    zoom_start=2
    )
I can plot the locations by iterating over the dataframe rows as follows:
x = data[['Lat', 'Lon', 'Color']].copy()

    for index, row in x.iterrows():
        folium.Marker([row['Lat'], row['Lon']],
                            popup=row['Color'],
                            icon=folium.Icon(color="red", icon="info-sign")
                           ).add_to(world)

    world
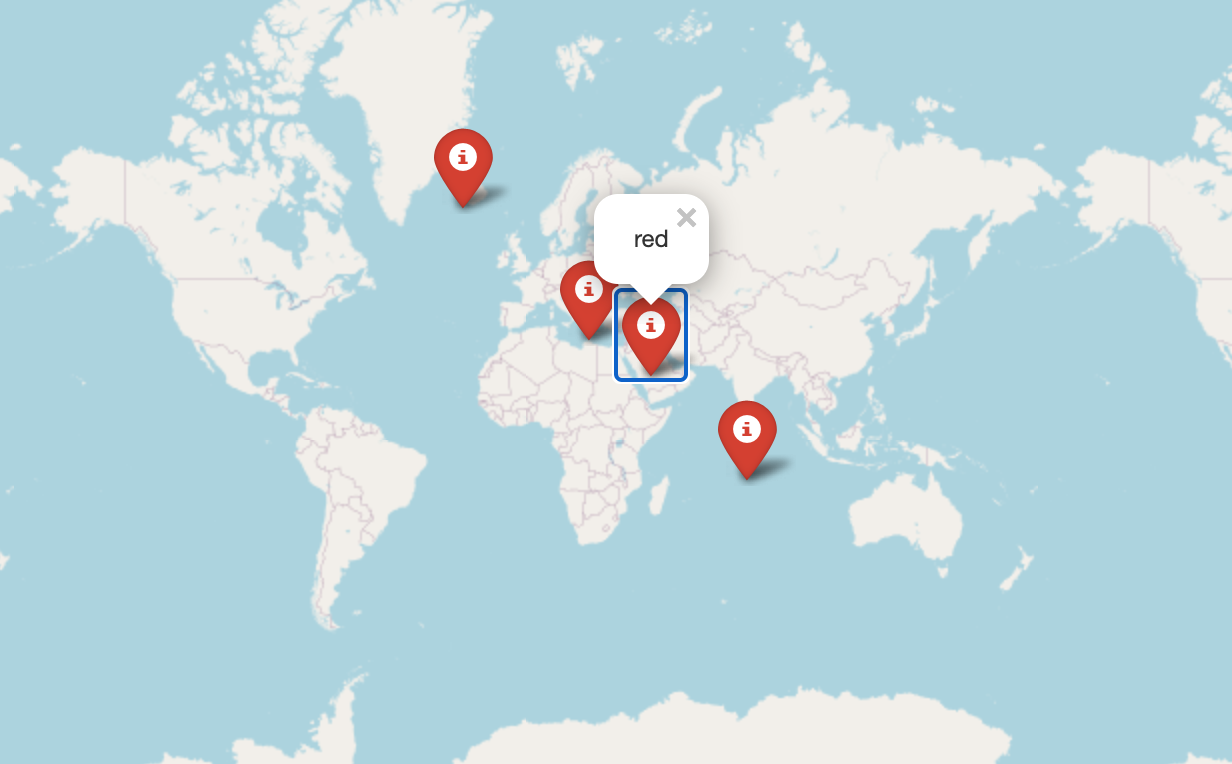
This produces the following graphic:
In order to use a custom icon I need to use folium.features.CustomIcon and state the image path as a location on my Google Drive where the image is stored.
pushpin = folium.features.CustomIcon('/content/drive/My Drive/Colab Notebooks/pushpin.png', icon_size=(30,30))
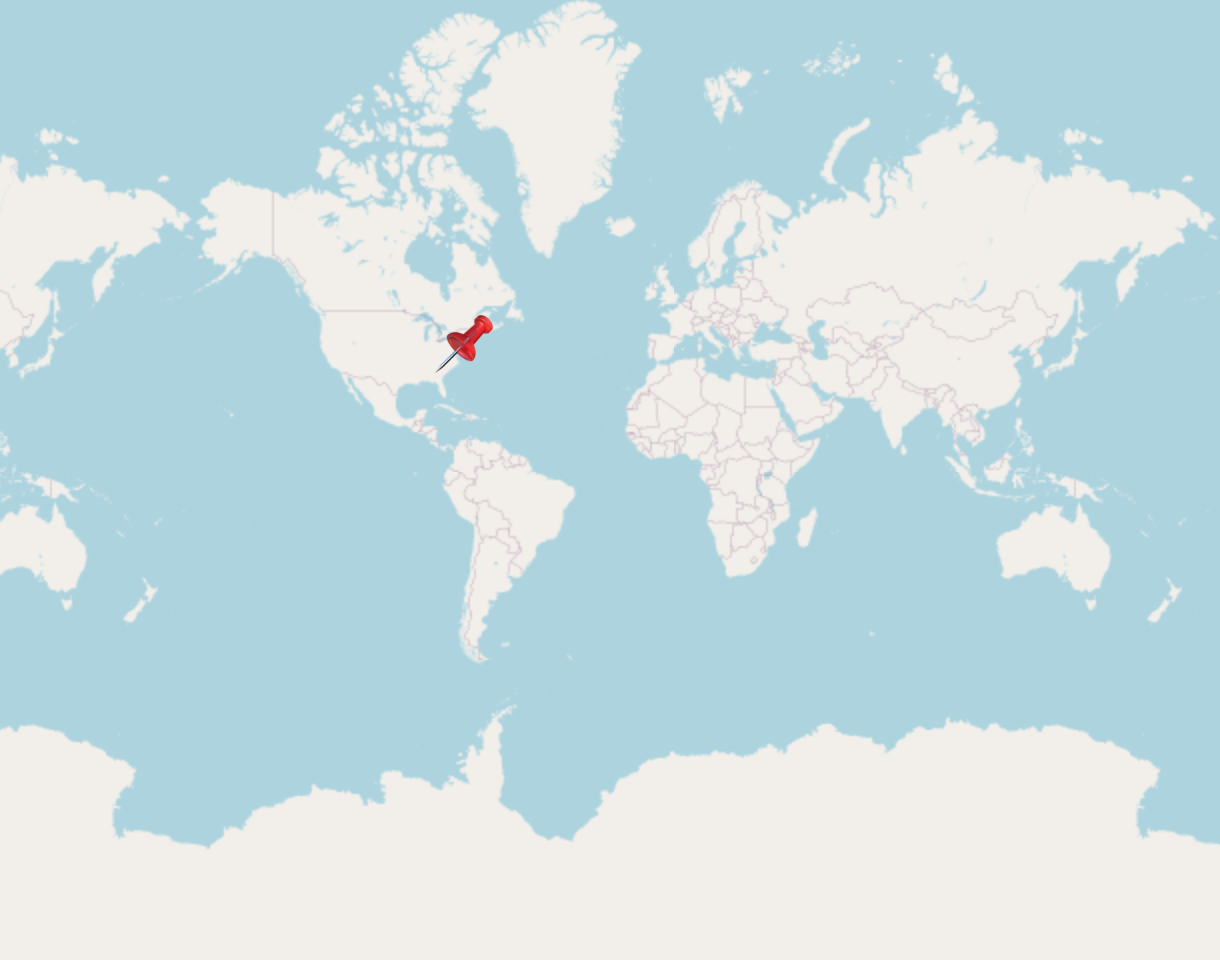
I can use this on the map in one stated location as follows:
world = folium.Map(
    zoom_start=2
    )

folium.Marker([40.743720, -73.822030], icon=pushpin).add_to(world)
world
Which produces the following graphic

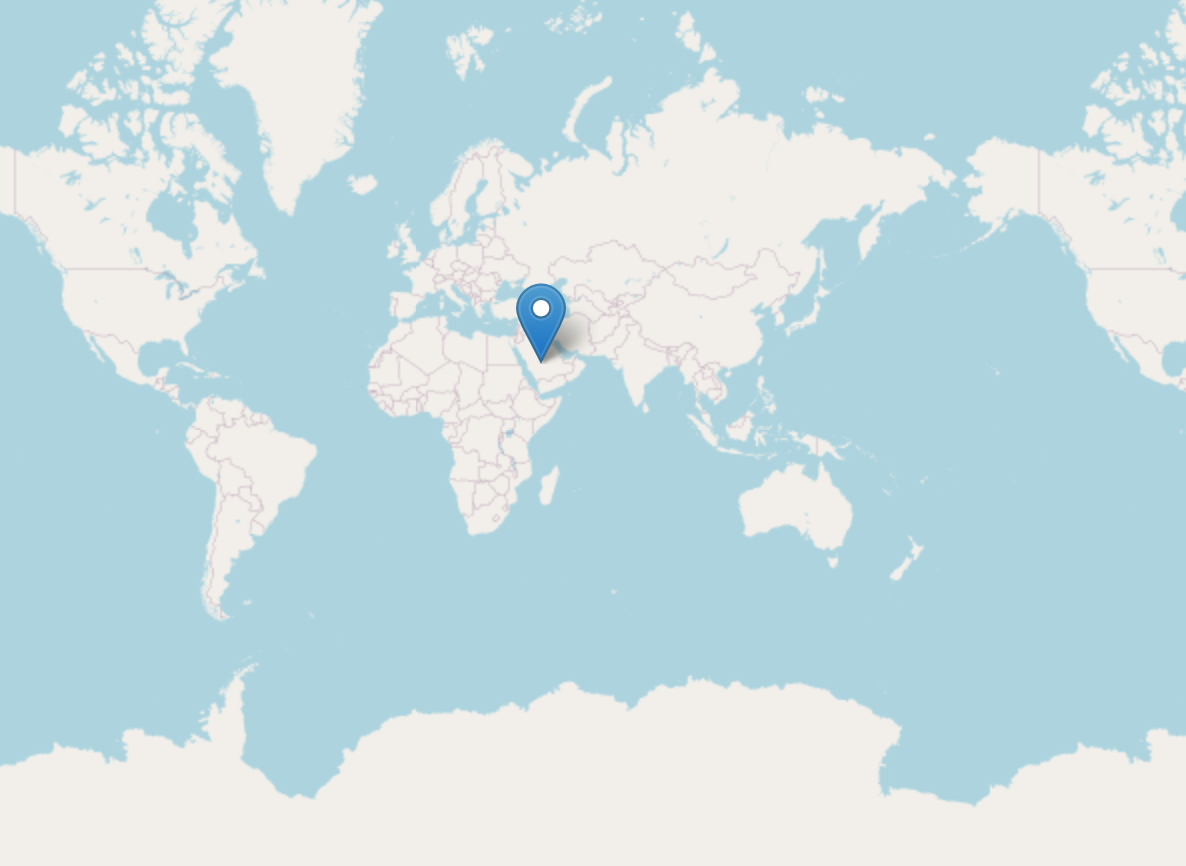
However, when I try to use the custom icon in the iteration, it does not seem to work and only plots the first coordinate pair with the default marker.
pushpin = folium.features.CustomIcon('/content/drive/My Drive/Colab Notebooks/pushpin.png', icon_size=(30,30))

    world = folium.Map(
    zoom_start=2
    )

    x = data[['Lat', 'Lon', 'Color']].copy()

    for index, row in x.iterrows():
         folium.Marker([row['Lat'], row['Lon']],
                                    icon=pushpin,
                                    popup=row['Color'],
                                   ).add_to(world)


            world
As pictured:
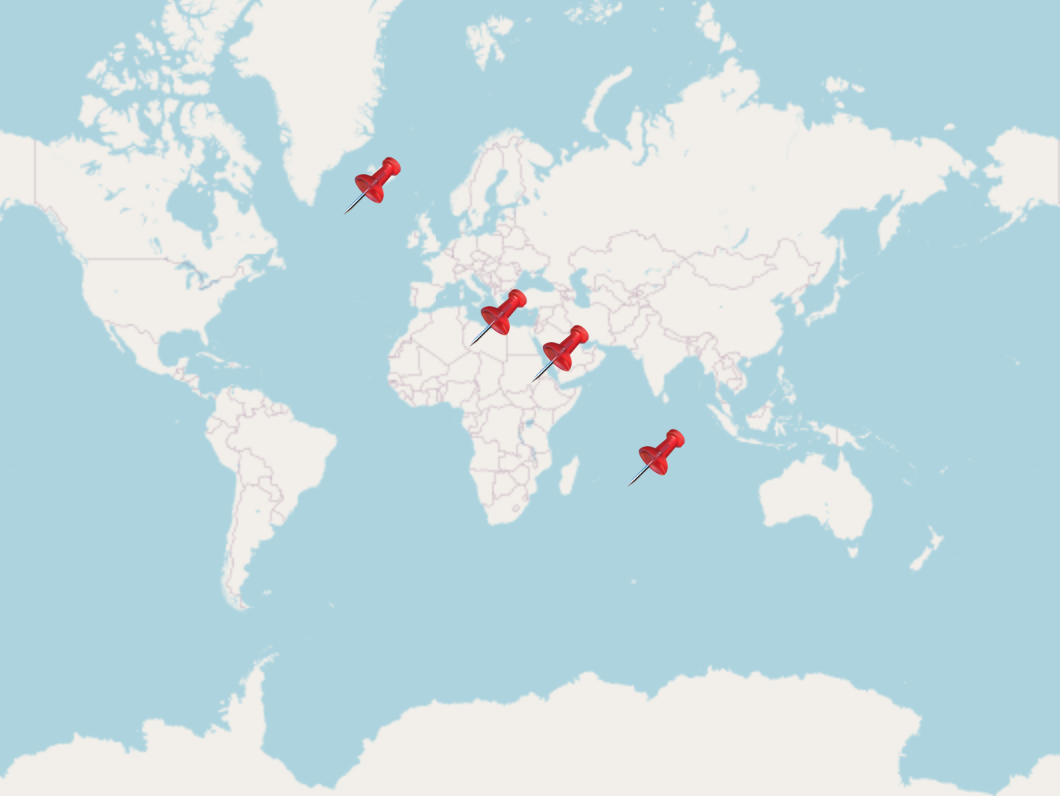
My expectation is for all 4 positions to be plotted with the pushpin marker.
Any help greatly appreciated.


