Filtering signal frequency in Python
Asked Answered
I

2

8

I tried to filter some signal with fft. The signal I am working on is quite complicated and im not really experienced in this topic. That's why I created a simple sin wave 3Hz and tried to cut off the 3 Hz.

and so far, so good

import numpy as np
import matplotlib.pyplot as plt
from scipy.fftpack import fftfreq, irfft, rfft

t = np.linspace(0, 2*np.pi, 1000, endpoint=True)
f = 3.0 # Frequency in Hz
A = 100.0 # Amplitude in Unit
s = A * np.sin(2*np.pi*f*t) # Signal
dt = t[1] - t[0] # Sample Time

W = fftfreq(s.size, d=dt)
f_signal = rfft(s)

cut_f_signal = f_signal.copy()
cut_f_signal[(np.abs(W)>3)] = 0 # cut signal above 3Hz

cs = irfft(cut_f_signal)

fig = plt.figure(figsize=(10,5))
plt.plot(s)
plt.plot(cs)

What i expected expected output

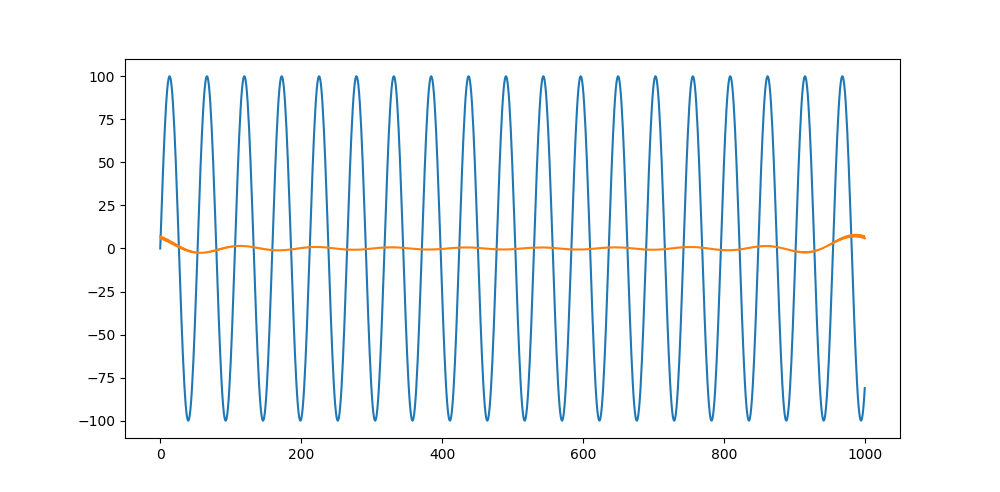
What i got Result

I don't really know where the noise is coming from. I think it is some basic stuff, but i dont get it. Can someone explain to to me?

Edit

Just further information

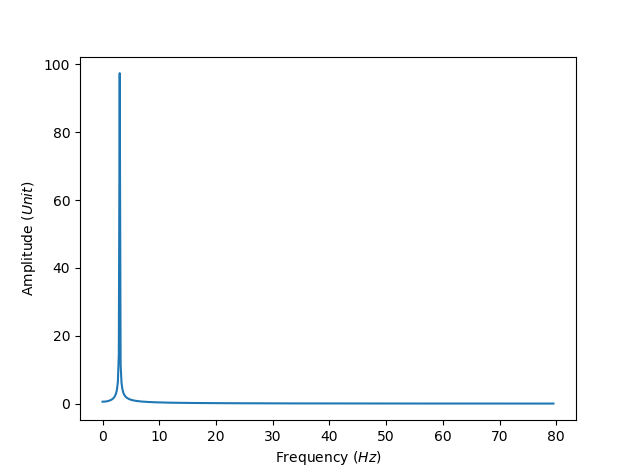
Frequency

yf = fft(s)
N = s.size
xf = np.linspace(0, fa/2, N/2, endpoint=True)
fig, ax = plt.subplots()
ax.plot(xf,(2.0/N * np.abs(yf[:N//2])))
plt.xlabel('Frequency ($Hz$)')
plt.ylabel('Amplitude ($Unit$)')
plt.show()

enter image description here

Insurrectionary answered 22/3, 2018 at 10:37 Comment(0)
J
6

You could change the way you create your signal and use a sample frequency:

fs = 1000
t = np.linspace(0, 1000 / fs, 1000, endpoint=False) # 1000 samples
f = 3.0 # Frequency in Hz
A = 100.0 # Amplitude in Unit
s = A * np.sin(2*np.pi*f*t) # Signal
dt = 1/fs

And here the whole code:

import numpy as np
import matplotlib.pyplot as plt
from scipy.fftpack import fftfreq, irfft, rfft

fs = 1000
t = np.linspace(0, 1000 / fs, 1000, endpoint=False)
f = 3.0 # Frequency in Hz
A = 100.0 # Amplitude in Unit
s = A * np.sin(2*np.pi*f*t) # Signal
dt = 1/fs

W = fftfreq(s.size, d=dt)
f_signal = rfft(s)

cut_f_signal = f_signal.copy()
cut_f_signal[(np.abs(W)>3)] = 0 # cut signal above 3Hz

cs = irfft(cut_f_signal)

fig = plt.figure(figsize=(10,5))
plt.plot(s)
plt.plot(cs)

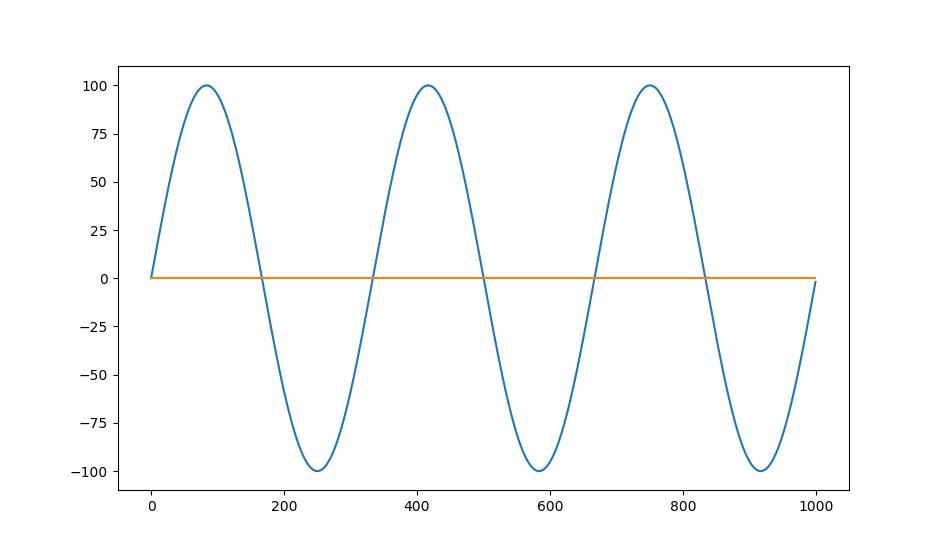
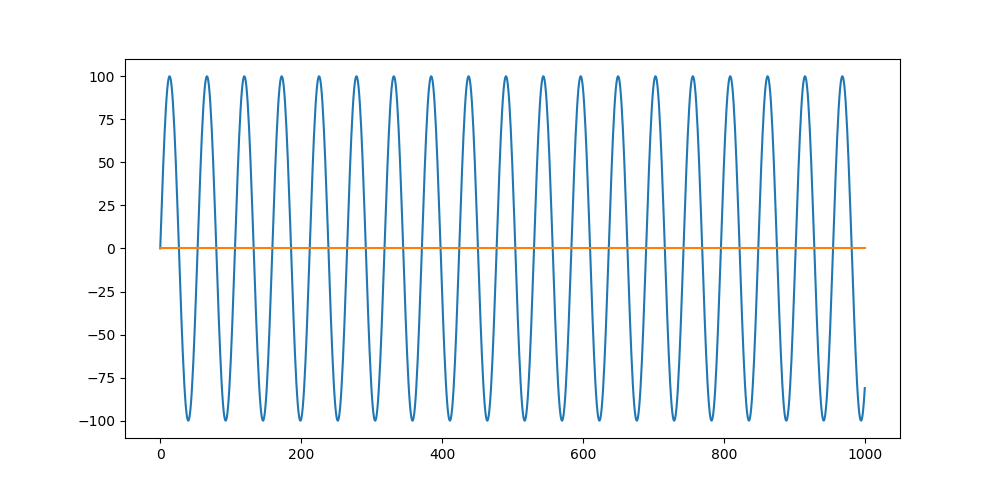
And with f = 3.0 Hz and (np.abs(W) >= 3): enter image description here

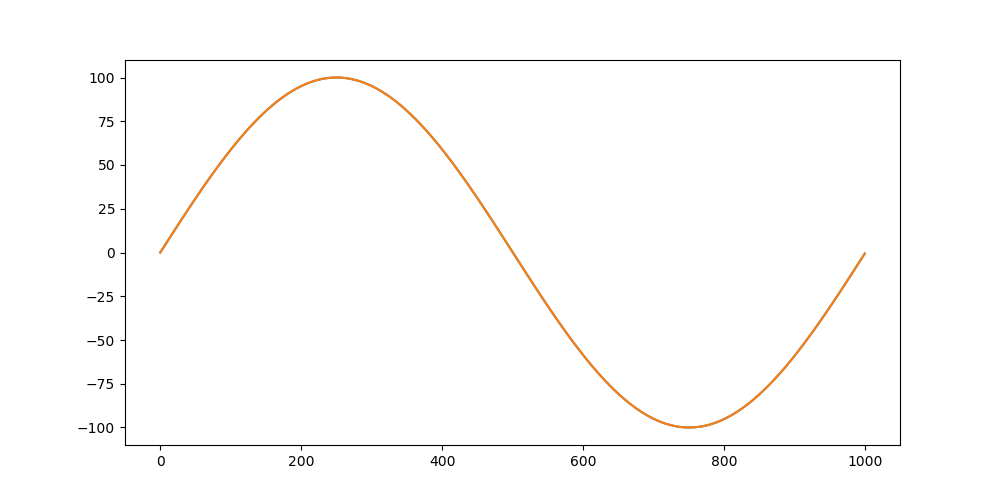
And with f = 1.0 Hz: enter image description here

Jeanene answered 22/3, 2018 at 11:58 Comment(1)
thanks that works fine, i thought about changing my signal but the frequency (last plot) looks fine that's why I left it that wayInsurrectionary
C
3

Just some additional information about why A. As solution works better than yours:

A. A's model doesn't include any non-integer frequencies in its Solution and after filtering out the higher frequencies the result looks like:

1.8691714842589136e-12 * exp(2*pi*n*t*0.0)
1.033507502555532e-12 * exp(2*pi*n*t*1.0)
2.439774536202658e-12 * exp(2*pi*n*t*2.0)
-8.346741339115191e-13 * exp(2*pi*n*t*3.0)
-5.817427588021649e-15 * exp(2*pi*n*t*-3.0)
4.476938066992472e-14 * exp(2*pi*n*t*-2.0)
-3.8680170177940454e-13 * exp(2*pi*n*t*-1.0)

while your solution includes components like:

...

177.05936105690256 * exp(2*pi*n*t*1.5899578814880346)
339.28717376420747 * exp(2*pi*n*t*1.7489536696368382)
219.76658524130005 * exp(2*pi*n*t*1.9079494577856417)
352.1094590251063 * exp(2*pi*n*t*2.0669452459344453)
267.23939871205346 * exp(2*pi*n*t*2.2259410340832484)
368.3230130593005 * exp(2*pi*n*t*2.384936822232052)
321.0888818355804 * exp(2*pi*n*t*2.5439326103808555)

...

Please refer to this question regarding possible side effects of zeroing FFT bins out.

Chongchoo answered 22/3, 2018 at 14:3 Comment(2)
Agree with zeroing bins FFT being a bad idea.Jeanene
thanks, I'll take a look at that. I plotted the frequency of the ifft signal and thats looks pretty weird, know i know why :)Insurrectionary

© 2022 - 2024 — McMap. All rights reserved.