How to control node color in ggraph?
Asked Answered
T

2

8

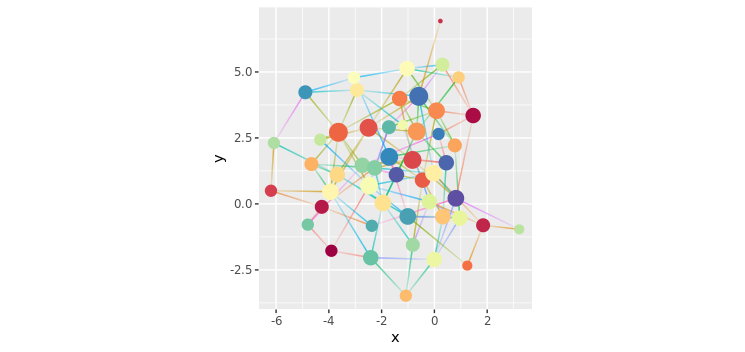
I have a network graph, and I would like to color the edges to match their respective nodes. This is rather straight forward in an igraph plot, but I'd prefer to do in ggraph as I like the other aesthetics offered by the package.

There seems to be little control over node color within the ggraph; while edge color is covered extensively.

My question is this: how can I match my edges to their nodes that have been colored using a custom function, so that each edge that 'leaves' a node is colored the same as its node. This should help people follow flows through the network easier. A more generally question is this: how does ggraph assign colors outside of the aesthetic argument. My question is similar to another question I've asked here before, but the other way around (match edges to nodes), found here.

Here is a reproducible example:

library(tidyverse)
library(igraph)
library(ggraph)
library(tidygraph)
library(RColorBrewer)

## the custom function using Color Brewer
cols_f <- colorRampPalette(RColorBrewer::brewer.pal(11, 'Spectral'))

## make the graph
g <- erdos.renyi.game(50, .1) 

# provide some names
V(g)$name <- 1:vcount(g)

#plot using ggraph
g %>% 
  as_tbl_graph() %>% 
  activate(nodes) %>% 
  mutate(degree  = centrality_degree()) %>% 
  ggraph()+
  geom_edge_fan(aes(color = as.factor(from),
                    alpha = ..index..),
                show.legend = F)+
  geom_node_point(aes(size = degree), 
                  color = cols_f(vcount(g)), # custom function for node color
                  show.legend = F)+
  scale_color_manual(values = cols_f(ecount(g)))+ # custom function for edge color
  coord_equal()

enter image description here

Tantra answered 14/1, 2019 at 16:31 Comment(0)
E
5

I personally find working explicitly with the layout object helpful to understand the variable mapping.

It has the classes "layout_igraph"+"layout_ggraph"+"data.frame" and contains

  1. a data.frame for the nodes with their coordinates as defined by create_layout as well as
  2. the input "tbl_graph"+"igraph" object (see attributes(layout)$graph)

The former is accessed by geom_node_point to draw the nodes, the latter by geom_edge_fan to draw the edges.

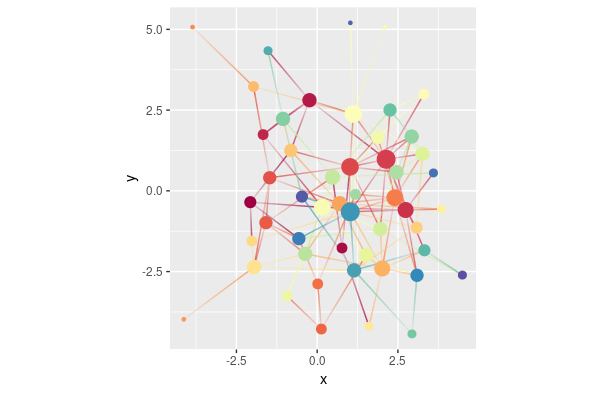
The color of the nodes can be controlled with the ggplot2 standard scale_color_manual, the color of the edges with the ggraph addition scale_edge_color_manual. Both can be used with the same node-name~color mapping if the limits attribute is set accordingly, because it contains...

a character vector that defines possible values of the scale and their order.


library(tidyverse)
library(igraph)
library(ggraph)
library(tidygraph)

## the custom function using Color Brewer
cols_f <- colorRampPalette(RColorBrewer::brewer.pal(11, 'Spectral'))

## make the graph
g <- erdos.renyi.game(50, .1) 

# provide some names
V(g)$name <- 1:vcount(g)

# plot using ggraph
graph_tbl <- g %>% 
  as_tbl_graph() %>% 
  activate(nodes) %>% 
  mutate(degree  = centrality_degree()) 

layout <- create_layout(graph_tbl, layout = 'igraph', algorithm = 'nicely')

ggraph(layout) +
  geom_edge_fan(
    aes(color = as.factor(from), alpha = ..index..),
    show.legend = F
  ) +
  geom_node_point(
    aes(size = degree, color = as.factor(name)),
    show.legend = F
  ) +
  scale_color_manual(
    limits = as.factor(layout$name),
    values = cols_f(nrow(layout))
  ) +
  scale_edge_color_manual(
    limits = as.factor(layout$name),
    values = cols_f(nrow(layout))
  ) +
  coord_equal()

example graph

Echopraxia answered 16/3, 2019 at 14:2 Comment(5)
Thanks, but the node/edge color is not consistent throughout. It works for the dark red node, but if you look closely there are nodes with outdegrees are different colors.Tantra
You're right. I forgot to set the scale limits. Please test this updated version.Echopraxia
Thanks, this works well now. Do you mind explaining what's going on?Tantra
I added some explanation.Echopraxia
scale_edge_color_manual was the key for me - didn't find that previously.Tammeratammi
T
4

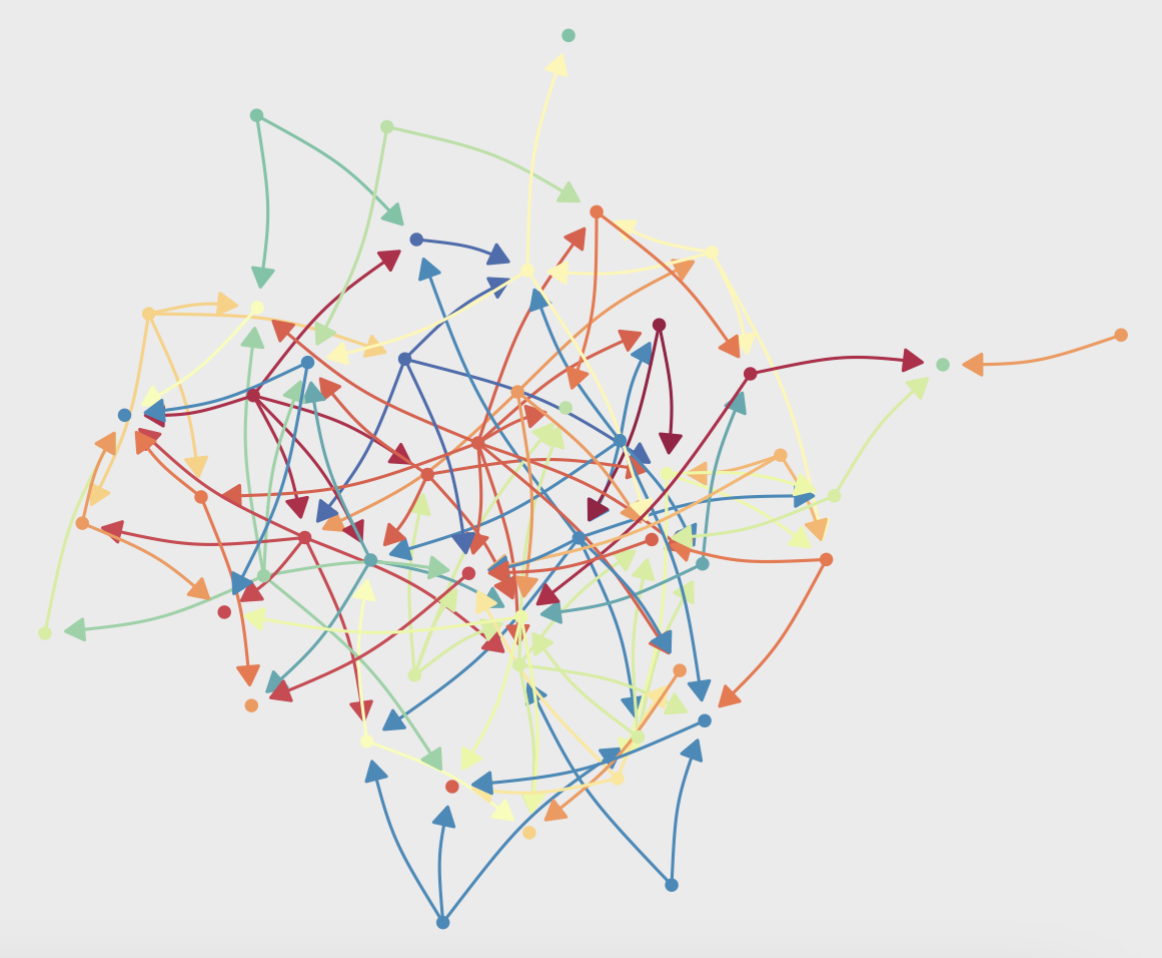
I've since learned how to do this. It's actually very straightforward and takes advantage of the tidygraph, which I'd recommend using for graph analysis. It is written to pair with ggraph, so makes for a good workflow.

Basically, you want to merge your node data with your edge data on either the from or to column - depending on which node you want your edges to match to.

Here's some code to do that below.

# same as original code above
library(tidyverse)
library(igraph)
library(ggraph)
library(tidygraph)
library(RColorBrewer)

# the custom function using Color Brewer
cols_f <- colorRampPalette(RColorBrewer::brewer.pal(11, 'Spectral'))

# make the graph
g <- erdos.renyi.game(50, .1) 

# provide some names
V(g)$name <- 1:vcount(g)

# Here's the new parts

# create random categories to the nodes
V(g)$category <- sample(LETTERS, vcount(g), T)

# number of colours to use
n_groups <- length(unique(V(g)$category))

# turn igraph into tbl_graph (still igraph under the hood!)
g_tbl <- as_tbl_graph(g)

# create new tibble from nodes with a variable from to merge with edges
node_from <- g_tbl %>%
    as_tibble() %>%
    mutate(from = row_number())

# merge with edges on the new 'from' variable
new_g_tbl <- g_tbl %>%
    activate(edges) %>%
    left_join(node_from) 

# plot
new_g_tbl %>%
    ggraph() +
    geom_edge_arc(
        aes(color = category),
        end_cap = circle(2.5, 'mm'),
        arrow = arrow(length =
                          unit(2.5,
                               'mm'),
                      type = 'closed'),
        strength = 0.1,
        show.legend = F
    ) +
    geom_node_point(aes(color = category),
                    show.legend = F) + 
    # use defined palette
    scale_edge_colour_manual(values = cols_f(n_groups)) + 
    scale_colour_manual(values = cols_f(n_groups))

Network diagram coloured using Spectral palette

Tantra answered 11/9, 2020 at 9:56 Comment(0)

© 2022 - 2024 — McMap. All rights reserved.