How to clean Plots (GR) without closing Julia environment
Asked Answered
N

3

8

I'm debugging a script (which use Plots.jl with GKS QtTerm backend). So I run the script many times. When I run it from terminal like bash> julia pointPlacement.jl it takes for ages to initialize Julia and Plots.jl (this is one big inconvenience in comparison to python). Therefore I rather keep Julia open and run the script from within, like julia> include( "pointPlacement.jl" )

grid = [ [ix*0.01 iy*0.01] for ix=1:100, iy=1:100 ]
grid = vcat(ps...)

centers = hexGrid( 2, 0.2 )

using Plots
display(scatter!( grid[:,1], grid[:,2], markersize = 1, markerstrokewidth = 0, aspect_ratio=:equal ))
display(scatter!( centers[:,1], centers[:,2], markersize = 2, markerstrokewidth = 0, aspect_ratio=:equal ))

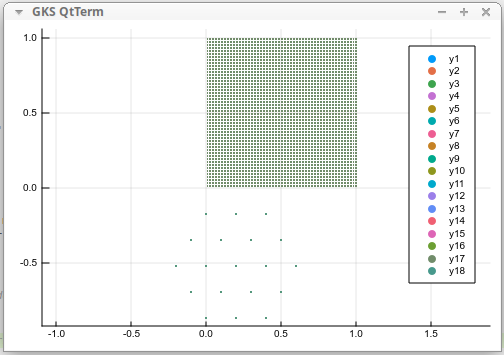
The problem is that the plots accumulate. This is after 9 runs. There should be just 2 datasets, not 18:

enter image description here

I want to close (kill,destroy) them

If I remove ! like this, it helps

display(scatter( grid[:,1], grid[:,2], markersize = 1, markerstrokewidth = 0, aspect_ratio=:equal ))
display(scatter!( centers[:,1], centers[:,2], markersize = 2, markerstrokewidth = 0, aspect_ratio=:equal ))

but still, I worry that some junk (previous figures) stay allocated in memory and Julia will crash after I run the script 100x. Therefore I would like to call some function like clear(),flush(),closeAll() ... or something ... everytime I run the script

Nonmetal answered 16/10, 2019 at 14:19 Comment(2)
BTW, I think those display calls are unnecessary, aren't they?Hogue
yes they are ... just I saw them in some tutorial so I was trying if it helpsNonmetal
H
4

Removing the ! has the effect that you want - the plot is gone if you call scatter again and it doesn't live somewhere in the background.

If you want you can store the plot in a variable and overwrite it "to be safe", i.e.

p = scatter(...)
scatter!(p, ...)

, where ... are your plotting arguments. This will explicitly overwrite p on every include.

Hogue answered 16/10, 2019 at 15:42 Comment(2)
The reason why I'm suspicious memory is not cleaned is that GR sometimes crash with error message like to many files open (or to many instances open) and than broken pipe (I cannot reproduce it now and I don't remember exact message). So I was thinking it is related.Nonmetal
But this could have other reason - I have two instances of Julia running (one in bash-terminal inside vscode and other in separate bash-terminal where I try simple sniples). And both are using Pyplot with GR, and I see there is cross-talk (because when it crash the error appears in the other terminal then the one where I call the last plot function)Nonmetal
M
4

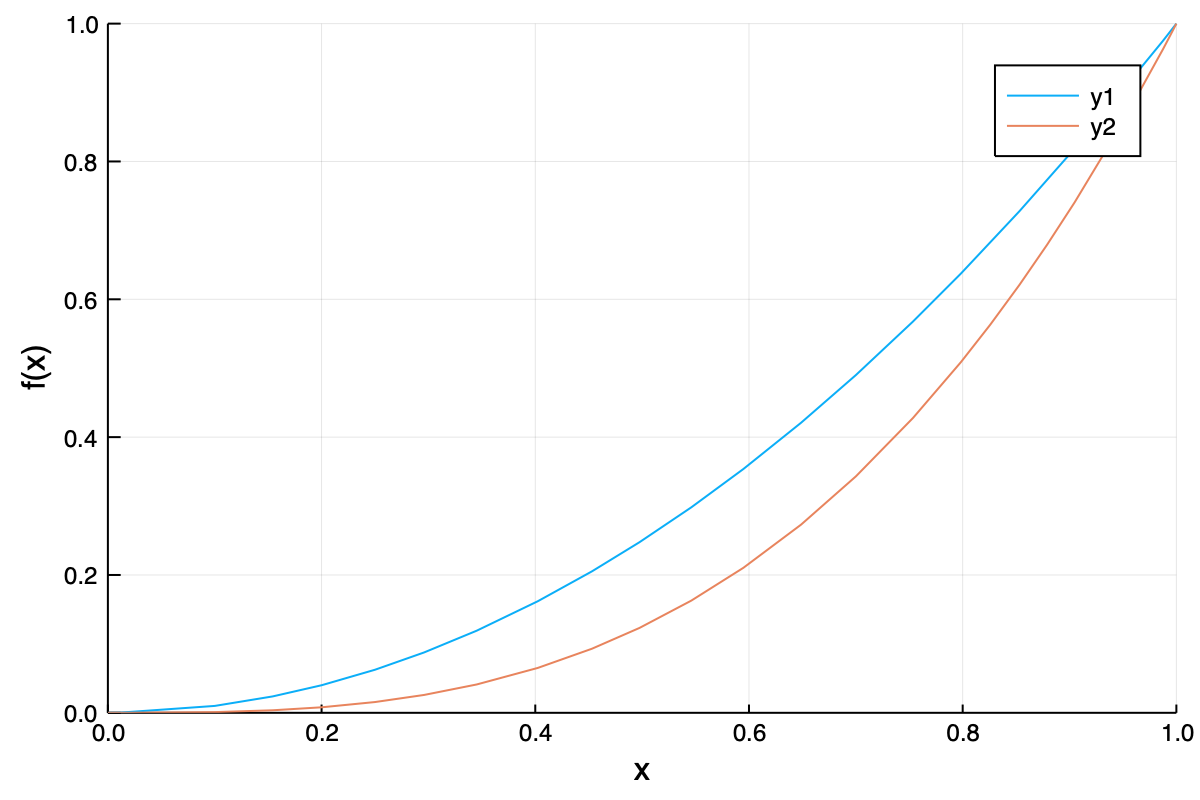
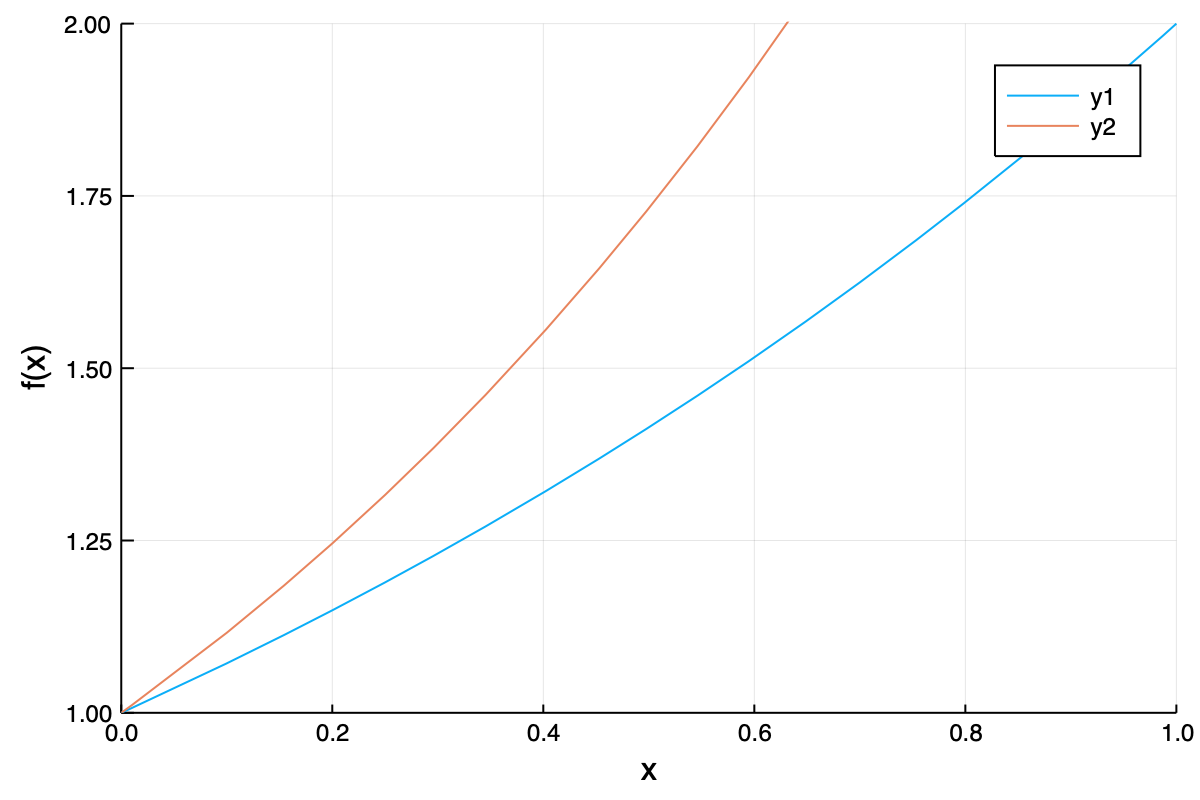
This is a long comment on crstnbr's excellent answer. If you want to make a new plot, but it shares similarities with the previous one, you can define a "canvas" (for want of a better word) in a function, which I have named new_plot(), and reuse the canvas. This is particularly useful if you have long labels and titles that you do not want to keep copying from plot to plot:

using Plots

function new_plot()
    plot(xlabel = "x", ylabel = "f(x)",
        xlims = (0,Inf), ylims = (-Inf, 1))
end 

p = new_plot()
plot!(p, x -> x^2, 0, 1)
plot!(p, x -> x^3, 0, 1)

enter image description here

p = new_plot()
plot!(p, x -> 2^x, 0, 1)
plot!(p, x -> 3^x, 0, 1)

enter image description here

Edit: Not directly related to the OP anymore, but note that, as pointed out by Benoît Pasquier in a comment, you can set default options with:

default(xlabel = "x", ylabel = "f(x)", 
        xlims = (0,:auto), ylims = (:auto, 1))

but you'll still need to create a new plot to "overwrite" the previous one, as explained by crstnbr. Consider this:

using Plots
p = plot()
for i in 1:5
    plot!(p, x -> x^i, 0, 1)
end

Nothing happened? Now try this:

p  # after a loop, you must call the plot object to display it
Marketable answered 28/4, 2021 at 23:31 Comment(5)
What about, instead, using a NamedTuple for these keyword arguments? E.g., first create options = (xlabel = "x", ylabel = "f(x)", xlims = (0,Inf), ylims = (-Inf, 1)) and then you can simply use p = plot(x -> x^2, 0, 1; options...).Pacifism
There's also default(xlabel = "x", ylabel = "f(x)", xlims = (0,:auto), ylims = (:auto, 1)) if you always use the same default attributes, and then no need to even type anything! :)Pacifism
Ah sorry I changed those Inf to :auto for my local tests, but :auto should work I think. What version of Plots.jl are you on? (I'm on v1.13.2, GR_jll v0.57.2+0)Pacifism
You probably have anotehr package that is holding back a dependency. You can try to pkg> add [email protected] and investigate what's preventing the update. What I do is make sure my default environment is minimal and only has things I use all the time (Plots is one of them) and then always pkg> activate --temp to start a fresh environement for any MWE.Pacifism
Hi Benoit! Thanks. You're right I had a package that was holding Plots back. It wasn't easy to diagnose. I deleted my .julia directory and reinstalled my packages and I was still stuck with the old version! Fortunately running Pkg.pkg"add Plots#master" helped me to identify the package that was messing things up. Thanks for your help! And now :auto works. Cool trick!Marketable
V
1

I found setting Plots.CURRENT_PLOT.nullableplot = nothing to be the easiest way to clear the current plot.

Vasoconstrictor answered 7/12, 2022 at 20:2 Comment(0)

© 2022 - 2024 — McMap. All rights reserved.