How to mask outside or inside an arbitrary shape in Python?
Asked Answered
A

2

8
from scipy import interpolate
import matplotlib.pyplot as plt
import numpy as np
import cv2
a=np.arange(1,9)
filename = 'image_file_0.tiff'
img = cv2.imread(filename)
x = np.array([389, 392, 325, 211, 92,103,194,310])
y = np.array([184,281,365,401,333,188,127,126])
x = np.r_[x, x[0]]
y = np.r_[y, y[0]]
tck, u = interpolate.splprep([x, y], s=0, per=True)
xi, yi = interpolate.splev(np.linspace(0, 1, 1000), tck)
fig, ax = plt.subplots(1, 1)

ax.plot(xi, yi, '-b')
plt.imshow(img)
plt.show()

my_image

I want to transform the pixel values of the outer or inner region after forming an arbitrary closed curve in the image. How do I do it?

Audible answered 12/4, 2022 at 6:15 Comment(0)
O
7

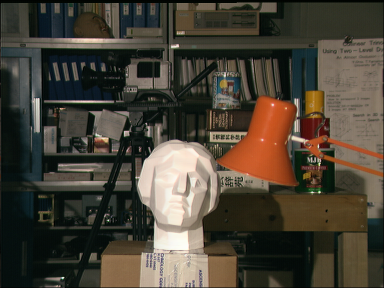
You can do it using the cv2.fillpoly function. Using this picture for example:

enter image description here

We can get the shape we want to mask using:

from scipy import interpolate
import matplotlib.pyplot as plt
import numpy as np
import cv2
a=np.arange(1,9)
filename = 'image_file_0.tiff'
img = cv2.imread('image_left.png', cv2.IMREAD_COLOR)
x = np.array([289, 292, 125, 111,  40,  80, 94,210])
y = np.array([84 , 181, 265, 241,133, 88, 27,  40])
x = np.r_[x, x[0]]
y = np.r_[y, y[0]]
tck, u = interpolate.splprep([x, y], s=0, per=True)
xi, yi = interpolate.splev(np.linspace(0, 1, 1000), tck)

plt.imshow(img[:,:,[2,1,0]])
plt.scatter(xi, yi)
plt.show()

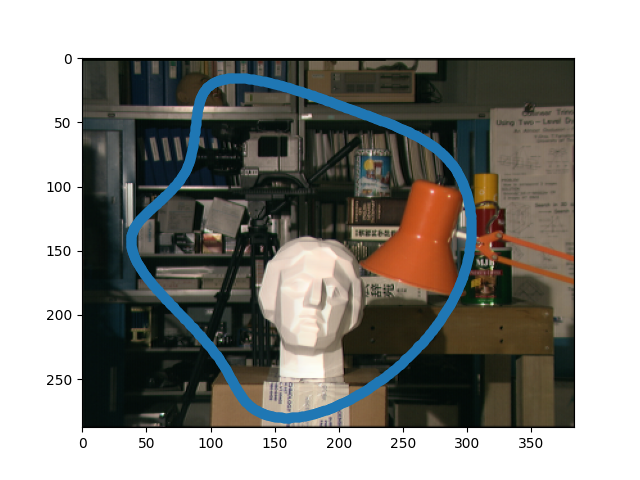
This results in: enter image description here

Now the masking can be done using:

contour = np.array([[xii, yii] for xii, yii in zip(xi.astype(int), yi.astype(int))])
mask    = np.zeros_like(img)
cv2.fillPoly(mask, pts=[contour], color=(255, 255, 255))
masked_img = cv2.bitwise_and(img, mask)

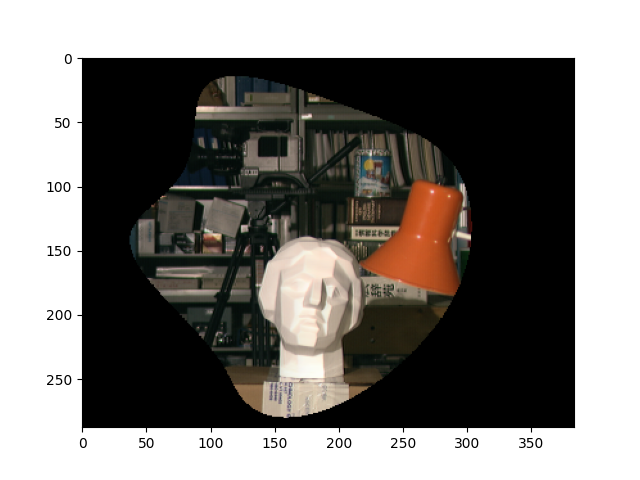
And the result: enter image description here

Using the inverted mask you manipulate the outer pixels as you wish:

mask    = np.ones_like(img)*255
cv2.fillPoly(mask, pts=[contour], color=(0,0,0))
masked_img = cv2.bitwise_and(img, mask)

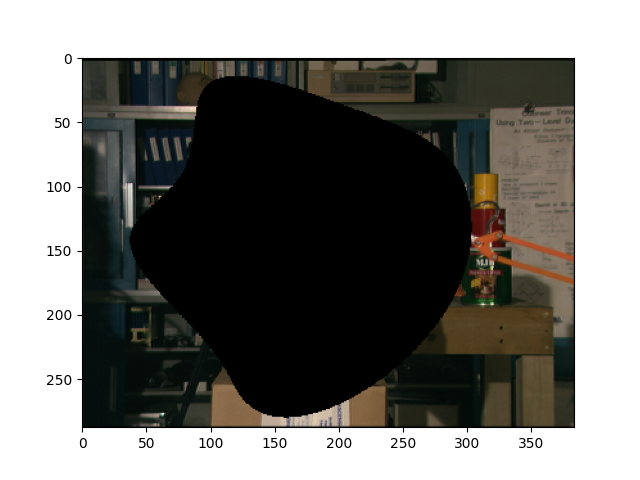
This results in:

enter image description here

Osman answered 12/4, 2022 at 7:17 Comment(1)
Yes I too had the same idea in mind using cv2.fillpoly. +1Ornate
K
2

Here's another way to do it using cv2.drawContours(). The idea is to take your rough contour points, smooth them out, draw this contour onto a mask, then cv2.bitwise_and() or inverse bitwise-and to extract the desired regions.


Input image -> Generated mask

Result -> Inverted result

import numpy as np
import cv2
from scipy import interpolate

# Load image, make blank mask, define rough contour points
image = cv2.imread('1.jpg')
mask = np.zeros(image.shape, dtype=np.uint8) 
x = np.array([192, 225, 531, 900, 500])
y = np.array([154, 281, 665, 821, 37])
x = np.r_[x, x[0]]
y = np.r_[y, y[0]]

# Smooth contours
tck, u = interpolate.splprep([x, y], s=0, per=True)
x_new, y_new = interpolate.splev(np.linspace(0, 1, 1000), tck)
smooth_contour = np.array([[[int(i[0]), int(i[1])]] for i in zip(x_new, y_new)])

# Draw contour onto blank mask in white
cv2.drawContours(mask, [smooth_contour], 0, (255,255,255), -1)
result1 = cv2.bitwise_and(image, mask)
result2 = cv2.bitwise_and(image, 255 - mask)

cv2.imshow('image', image)
cv2.imshow('mask', mask)
cv2.imshow('result1', result1)
cv2.imshow('result2', result2)
cv2.waitKey()
Knelt answered 12/4, 2022 at 9:38 Comment(1)
One problem many solutions!!Ornate

© 2022 - 2024 — McMap. All rights reserved.