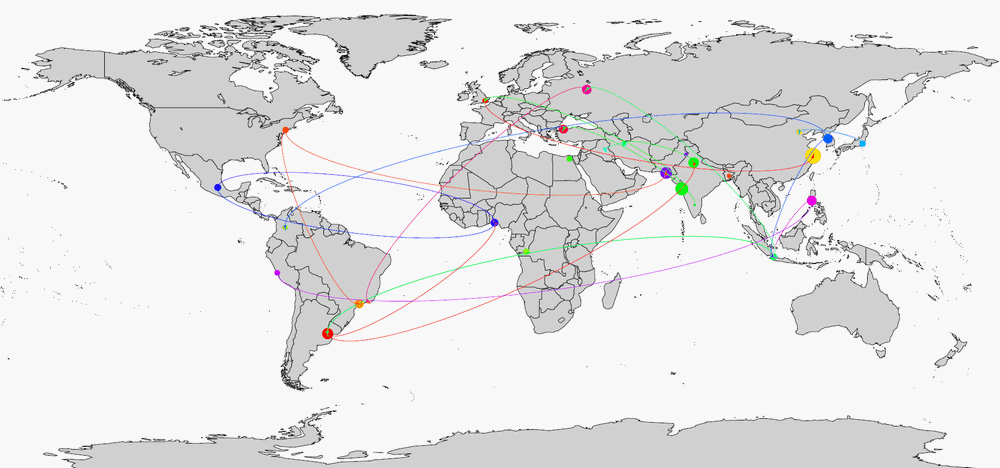
Well, FWIW: here's one quick&dirty way to plot vertices ("cities") on a map and connect the edges between vertices with arrows:
library(maps)
library(diagram)
library(plotrix)
palette(rainbow(20))
data("world.cities")

pdf(tf <- tempfile(fileext = ".pdf"), width = 40, height = 20)

map('world', fill = TRUE, col = "lightgray", mar = rep(0, 4))

nodes <- transform(with(world.cities, world.cities[pop > 5e6,]), country.etc = as.factor(country.etc))
with(nodes, points(long, lat, col=country.etc, pch=19, cex=rescale(pop, c(1, 8))))

set.seed(1)
edges <- subset(data.frame(from = sample(nodes$name, 20, replace = TRUE), to = sample(nodes$name, 20, replace = TRUE), stringsAsFactors = F), from != to)
edges <- merge(merge(edges, nodes[, c("name", "long", "lat")], by.x = "from", by.y = "name"), nodes[, c("name", "long", "lat")], by.x = "to", by.y = "name")
edges$col <- as.integer(nodes$country.etc[match(edges$from, nodes$name)])

apply(edges[, -(1:2)], 1, function(x) curvedarrow(to=x[3:4], from=x[1:2], lcol=x[5], curve=.1, arr.pos = 1, lwd=.5))

dev.off()
shell.exec(tf)
![enter image description here]()


