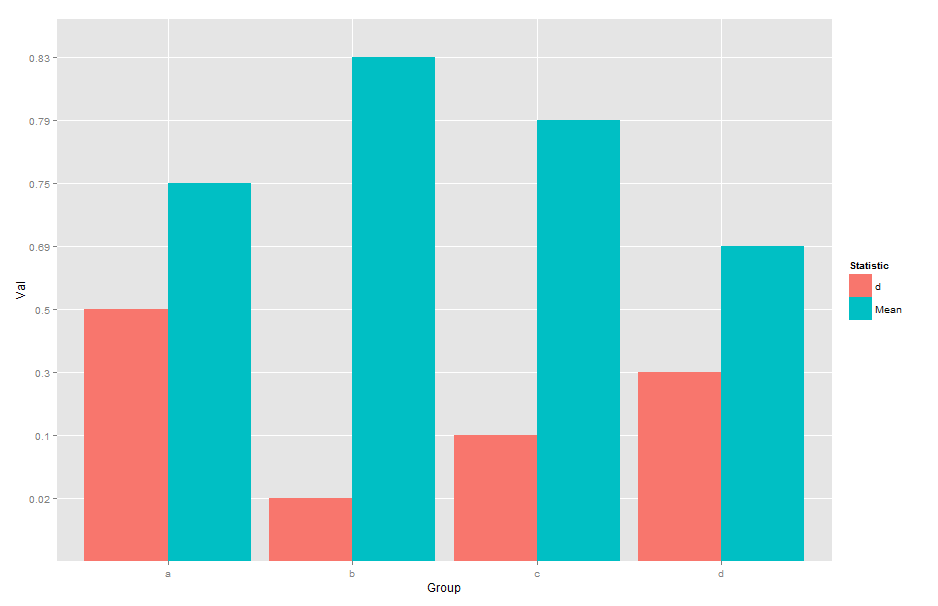
I have proportion response data for 4 experimental groups, with 2 different statistics computed for each group. I want the following figure (which I can achieve):
I obtain this figure with the following code:
Group<-c('a','b','c','d','a','b','c','d')
Statistic<-c('Mean','Mean','Mean','Mean','d','d','d','d')
Val<-c(.75,.83,.79,.69,.5,.02,.1,.3)
dfm2<-data.frame(cbind(Group,Statistic,Val))
ggplot(dfm2,aes(x = Group,y = Val)) +
 geom_bar(aes(fill = Statistic),position = dodge',stat='identity')
However, when I change the limits of the y-axis (to [0,1] since I have proportions) by adding the line of code:
+ scale_y_continuous(limits=c(0, 1))
I get
Error: Discrete value supplied to continuous scale
So I understand this means I have a non-continuous variable. I have tried converting my Statistic variable by using as.numeric() and countless other options but to no avail. If anyone can assist me in solving this problem and/or explain what causes it, I would be most appreciative.

