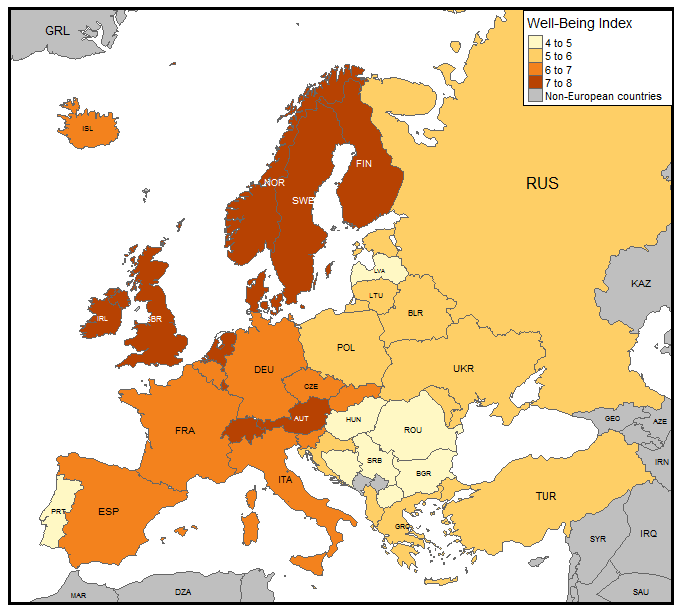
I'm not sure how or if is possible to adjust the key legends in the fallowing way. Consider the example:
library(tmap)
data(Europe)

my_map <-
  tm_shape(Europe) +
  tm_polygons("well_being", textNA="Non-European countries", title="Well-Being Index") +
  tm_text("iso_a3", size="AREA", root=5) +
  tm_layout(legend.position = c("RIGHT","TOP"),
            legend.frame = TRUE)
I tried legend.format = list(scientific = TRUE) in something like:
my_map2 <- my_map +
  tm_layout(legend.format = list(scientific = TRUE))
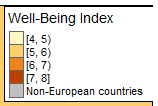
which gives this for a legend:
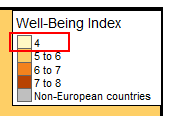
However, what I wish is something like:
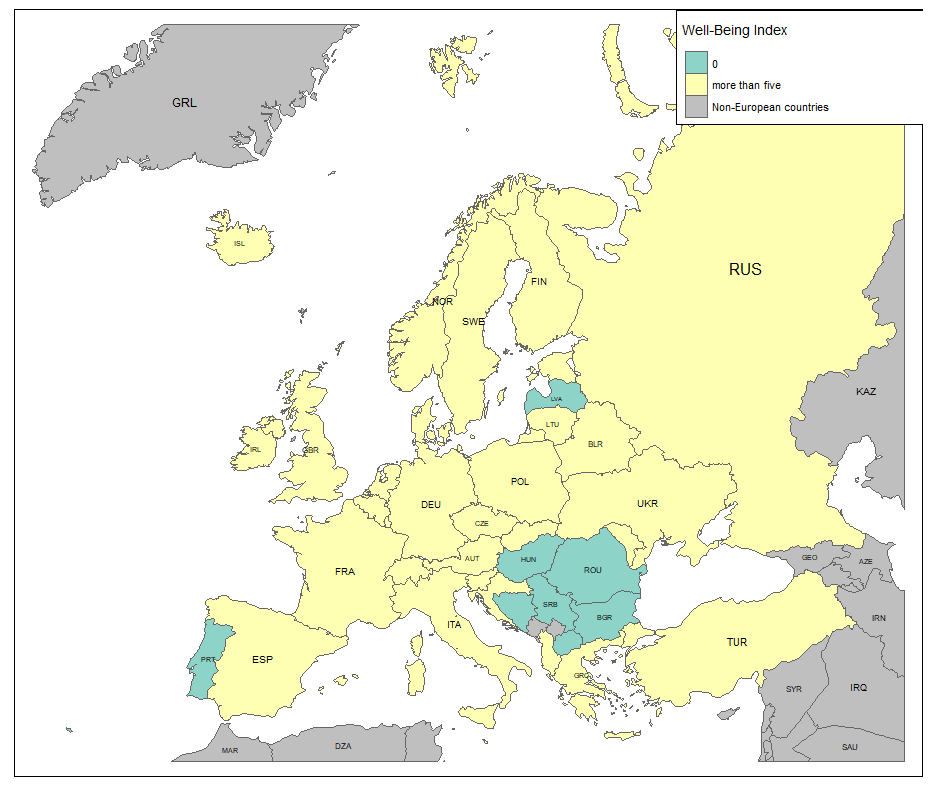
In my data, the 4 is a zero, and I was asked to make it stand out as zero alone.


ifelseI usedcutfunction as it allows to define labels and breaks. – Medusa