How to remove the first column (index) from data table in R Shiny
Asked Answered
A

1

8

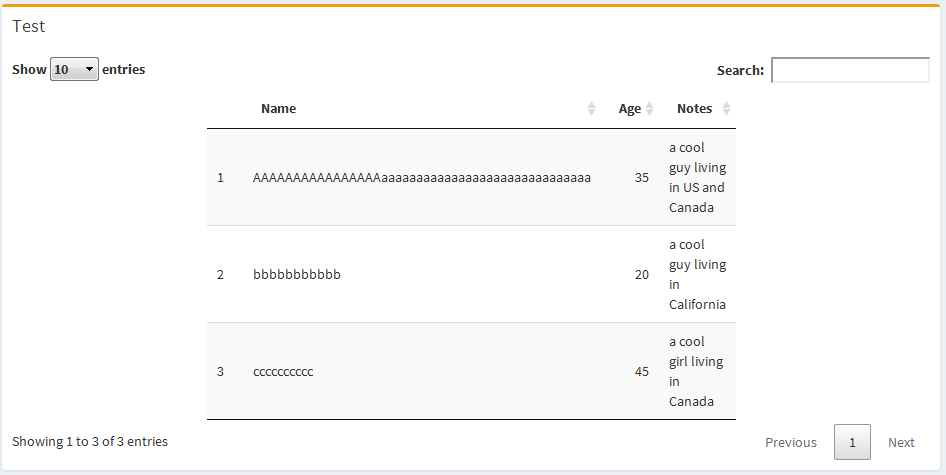
I am wondering if there is a way to remove the index column (1st column) from the data table in Shiny.

For example, column of (1, 2, 3) before Name column as shown in the screenshot below:

enter image description here

Below is my code:

header <- dashboardHeader(
  title = "Test"
)

sidebar <- dashboardSidebar(
)

body <- dashboardBody(
            box(title = "Test", width = 7, status = "warning", DT::dataTableOutput("df"))
)

# UI
ui <- dashboardPage(header, sidebar, body)

# Server
server <- function(input, output, session) {

  output$df = DT::renderDataTable(df, options = list(
    autoWidth = TRUE,
    columnDefs = list(list(width = '10px', targets = c(1,3)))))
    }

# Shiny dashboard
shiny::shinyApp(ui, server)

Thanks in advance.

Amidase answered 18/3, 2019 at 20:42 Comment(1)
Why not just index it out when you render it, DT::renderDataTable(df[-1], ...)Solve
G
10

There is some excellent documentation of the package available at https://rstudio.github.io/DT/ I would highly recommend reading through.

At any rate, use the rownames = FALSE argument provided by the DT package as follows:

library(shinydashboard)
library(DT)

df <- mtcars

header <- dashboardHeader(
  title = "Test"
)

sidebar <- dashboardSidebar(
)

body <- dashboardBody(
  box(title = "Test", width = 7, status = "warning", DT::dataTableOutput("df"))
)

# UI
ui <- dashboardPage(header, sidebar, body)

# Server
server <- function(input, output, session) {

  output$df = DT::renderDataTable(df, rownames = FALSE,
                                  options = list(
                                    autoWidth = TRUE,
                                    columnDefs = list(list(width = '10px', targets = c(1,3)))))
}

# Shiny dashboard
shiny::shinyApp(ui, server)
Grig answered 18/3, 2019 at 20:55 Comment(0)

© 2022 - 2024 — McMap. All rights reserved.