Show code coverage with a source code in Jenkins wiht Cobertura (run result from other machine)
Asked Answered
D

2

8

Background

I have large c++ application with complex directory structure. Structure is so deep that code repository can't be stored in Jenkins workspace, but is some root directory, otherwise build fails since path length limit is busted.

Now since application is tested in different environments, test application is run in diffrent machine. Application and all resources are compressed and copied to test machine where tests are run using OpenCppCoverage and as a result Cobertura xml is produced.

Now since source code is needed to show covarage result xml is copied back to build machine and then feed to Jenkins Cobertura plugin.

Problem

Coverage reports shows only percent results for module or source code. Code content is not show, but this error message is show:

Source

Source code is unavailable. Some possible reasons are:

  • This is not the most recent build (to save on disk space, this plugin only keeps the most recent build’s source code).
  • Cobertura found the source code but did not provide enough information to locate the source code.
  • Cobertura could not find the source code, so this plugin has no hope of finding it.
  • You do not have sufficient permissions to view this file.

Now I've found this SO answear which is promising:

The output xml file has to be in the same folder as where coverage is run, so:

coverage xml -o coverage.xml

The reference to the source folder is put into coverage.xml and if the output file is put into another folder, the reference to the source folder will be incorrect.

Problem is that:

  • I've run tests on different machine (this can be overcome by script which modifies paths in xml).
  • my source code can't be inside a workspace during a build time
  • placing xml in respective directory of source code is not accepted by Cobertura plugin. It ends with this error:
[Cobertura] Publishing Cobertura coverage report...

FATAL: Unable to find coverage results

java.io.IOException: Expecting Ant GLOB pattern, but saw 'C:/build_coverage/Products/MyMagicProduct/Src/test/*Coverage.xml'. See http://ant.apache.org/manual/Types/fileset.html for syntax

This is part of xml result (before modifications):

<?xml version="1.0" encoding="utf-8"?>
<coverage line-rate="0.63669186741173223" branch-rate="0" complexity="0" branches-covered="0" branches-valid="0" timestamp="0" lines-covered="122029" lines-valid="191661" version="0">
  <sources>
    <source>c:</source>
    <source>C:</source>
  </sources>
  <packages>
    <package name="C:\jenkins\workspace\MMP_coverage\MyMagicProduct\src\x64\Debug\MMPServer.exe" line-rate="0.63040511358728513" branch-rate="0" complexity="0">
      <classes>
        <class name="AuditHandler.cpp" filename="build_coverage\Products\MyMagicProduct\Src\Common\AuditHandler.cpp" line-rate="0.92682926829268297" branch-rate="0" complexity="0">
          <methods/>
          <lines>
            <line number="18" hits="1"/>
            <line number="19" hits="1"/>
            <line number="23" hits="1"/>
            <line number="25" hits="1"/>
            <line number="27" hits="1"/>
            ....
          </lines>
        </class>
   ....

The biggest issue is that I'm not sure if location of xml is actual a problem since plugin doesn't report details of the issues encountered when trying to fetch/find respective source code. Second bullet from Cobertura which may explain problem is totally confusing:

Cobertura found the source code but did not provide enough information to locate the source code.

What else I've tried

  1. I've ensured that anyone can read source code (to avoid problem with access)
  2. I've modified xml so filename contains path relative to: jenkins workspace, path where xml file with coverity report is located
  3. copied my source code to various locations, even containing "cobertura" directory since something like this I've found in plugin source code
  4. I've tried understand the issue by inspecting source code.
  5. I've found some (a bit old) github project which maybe a hint howto fix it - currently I'm trying to understudy what it exactly does (I don't want to import this project to my build structure).

So far no luck.

Update:

Suddenly (I'm not sure what I have done) it works for my account. Problem is that it works only for me all other users have same issue. This clearly indicate that issue must be a security.

Dugong answered 21/1, 2020 at 13:55 Comment(2)
The path length limit is a windows thing, not a Jenkins thing. Can you make a shorter path using symbolic links? Something like mklink src C:\jenkins\workspace\MMP_coverage\MyMagicProduct\src ?Duplicature
@Mzzl: Yes I'm aware of that. I just had to use different path (outside of Jenkins workspace) to avoid this windows issue. I wasn't sure it this could break Jenkins plugin behavior.Dugong
D
4

Ok I've found reasons why I had a problems with this plugin.

  1. xml from openCppCoverage is just correct. No changes are needed here to make it work (as far as sources are there where pdb file points to). Sources outside Jenkins workspace are not the problem here. When I copied executable from build machine to test machine, then run tests with openCppCoverage and copied result back to build machine it is just fine.

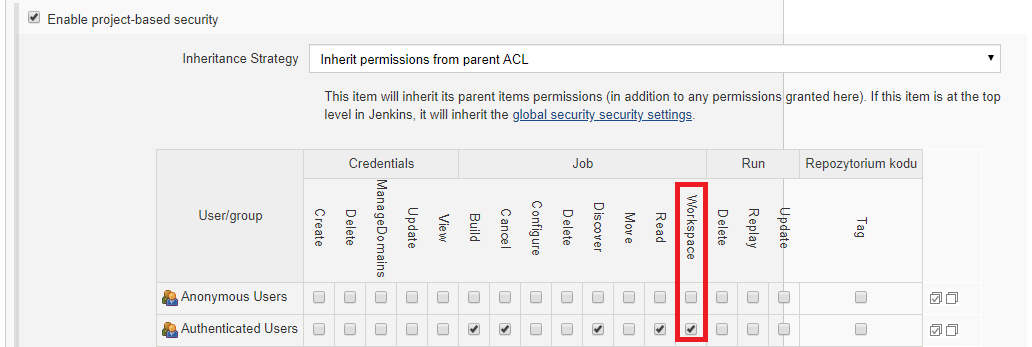
  2. In job configuration any user which supposed to view code coverage has to have access to Job/workspace in security section. In my case I've enabled this for all logged in users. enter image description here This covers last bullet point of error message.

  3. Most important thing: build must be successful. I mean form beginning to the end. Doesn't meter if step containing call to cobertura plugin was successful. If any step (even in the future step) fails then cobertura will not show code for this coverage run. In my case build job was failing since one of tests was timing out. This was caused by openCppCoverage overhead which slows down tests by factor 3. My script was detecting timeout and killing one of tests.

I discovered that not successful build was a problem by accident. During experiments I noticed two cases when cobertura has shown source code:

  • I've rerun job and removed all steps but one responsible for publishing coloratura results
  • I run whole job such way it run a single test case which passed

Not sowing coverage if build is not successful is reasonable (if test failed then most probably wrong branch of code has been taken), but UI should indicate that in different way.

Conclusion

This is great example how it is important to report errors to user with precise details what went wrong and why. I wasted at least whole weak to figure out what is actually wrong which bullet point of error message is actually my case. In fact error message from plugin doesn't cover all reasons of not showing the code.

I will file report that plugin should give better explanation what went wrong.

Dugong answered 28/1, 2020 at 15:16 Comment(0)
Q
6

I encountered a very similar issue when I had to develop a CI pipeline for a very huge C++ client. I had the best results if I avoided the Cobertura Plugin and instead used the HTML Publisher Plugin. The main issue I had was also finding the source files.

  1. Convert OpenCppCoverage result to HTML

This step is quite easy. You have to add the parameter --export_type=html:<outputPath> (see Commandline-reference) to the OpenCppCoverage call.

mkdir CodeCoverage
OpenCppCoverage.exe --export_type=html:CodeCoverage <GoogleTest.exe>

The commands above should result in a html-file in the directory <jenkins_workspace>/CodeCoverage/index.html

  1. Publish the OpenCppCoverage result

To do this we use the HTML Publisher Plugin as I mentioned above. reportDir is the directory created in step one and which contains our html-file. Its path is relative to the Jenkins workspace.

    publishHTML target: [
      allowMissing: false,
      alwaysLinkToLastBuild: true,
      keepAll: true,
      reportDir: 'CodeCoverage',
      reportFiles: 'index.html',
      reportName: 'Code Coverage'
      ]

and to be sure that everyone can download and check the result locally we archieve the result of OpenCppCoverage:

   archiveArtifacts artifacts: 'CodeCoverage/*.*'

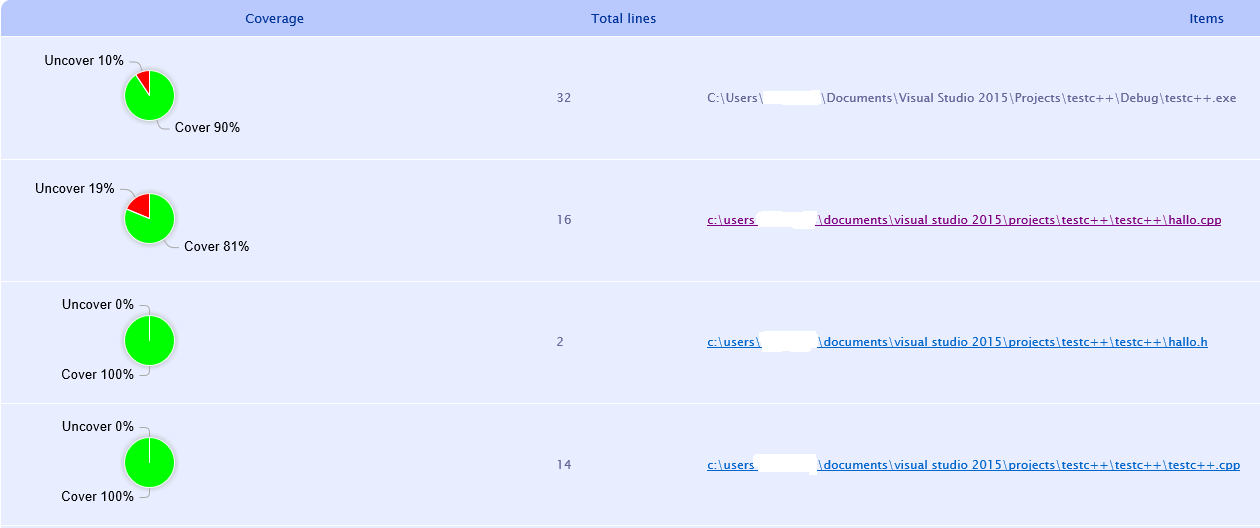
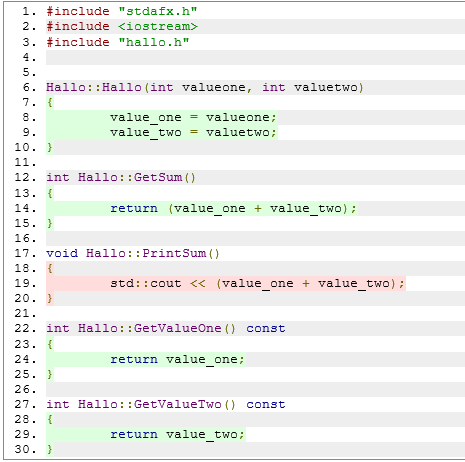
You can see the result now in the sidebar of your pipeline under Code Coverage and the result will look like the following:

enter image description here enter image description here

This is the solution that worked for me.

I hope this helps at least a bit. I can only advice do avoid the Cobertura Plugin. I wasted so much time try to fix it and recognize my sources...

Quickstep answered 24/1, 2020 at 16:8 Comment(3)
This is some solution, but not very handy. It would be nice to have charts showing improvements or regression in code coverage.Dugong
Maybe a mixture between the HTML Publisher Plugin and the Cobertura could work. Cobertura for the charts and the other for the source code level.Quickstep
I've mad coloratura plugin to work correctly (see other answer). IMO the main problem is error reporting by the plugin. Currently you have to spend lots of time to find out which reason actually is a problem.Dugong
D
4

Ok I've found reasons why I had a problems with this plugin.

  1. xml from openCppCoverage is just correct. No changes are needed here to make it work (as far as sources are there where pdb file points to). Sources outside Jenkins workspace are not the problem here. When I copied executable from build machine to test machine, then run tests with openCppCoverage and copied result back to build machine it is just fine.

  2. In job configuration any user which supposed to view code coverage has to have access to Job/workspace in security section. In my case I've enabled this for all logged in users. enter image description here This covers last bullet point of error message.

  3. Most important thing: build must be successful. I mean form beginning to the end. Doesn't meter if step containing call to cobertura plugin was successful. If any step (even in the future step) fails then cobertura will not show code for this coverage run. In my case build job was failing since one of tests was timing out. This was caused by openCppCoverage overhead which slows down tests by factor 3. My script was detecting timeout and killing one of tests.

I discovered that not successful build was a problem by accident. During experiments I noticed two cases when cobertura has shown source code:

  • I've rerun job and removed all steps but one responsible for publishing coloratura results
  • I run whole job such way it run a single test case which passed

Not sowing coverage if build is not successful is reasonable (if test failed then most probably wrong branch of code has been taken), but UI should indicate that in different way.

Conclusion

This is great example how it is important to report errors to user with precise details what went wrong and why. I wasted at least whole weak to figure out what is actually wrong which bullet point of error message is actually my case. In fact error message from plugin doesn't cover all reasons of not showing the code.

I will file report that plugin should give better explanation what went wrong.

Dugong answered 28/1, 2020 at 15:16 Comment(0)

© 2022 - 2024 — McMap. All rights reserved.