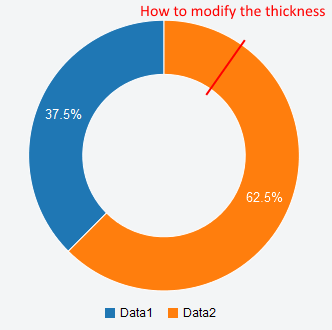
I would like to customize a donut chart from c3.js for example the arc thickness.
Any help or pointers are greatly appreciated.
var chart = c3.generate({
    data: {
        columns: [
            ['Data1', 30],
            ['Data2', 50],
        ],
        type : 'donut'
    },
});
Example: http://jsfiddle.net/ktjhh5qr/1/

