AWS QuickSight dashboard with multiple datasets
Asked Answered
O

1

8

Is it possible to create single AWS QuickSight dashboard containing analysis from different datasets?

What I have seen that one can create an analysis on a single dataset, can add multiple charts for the same one and it gets published as a dashboard.

Is it possible that we have one chart from dataset1 and another chart from dataset2 and both of them are part of a single analysis/dashboard?

Olvan answered 8/1, 2021 at 8:35 Comment(0)
P
12

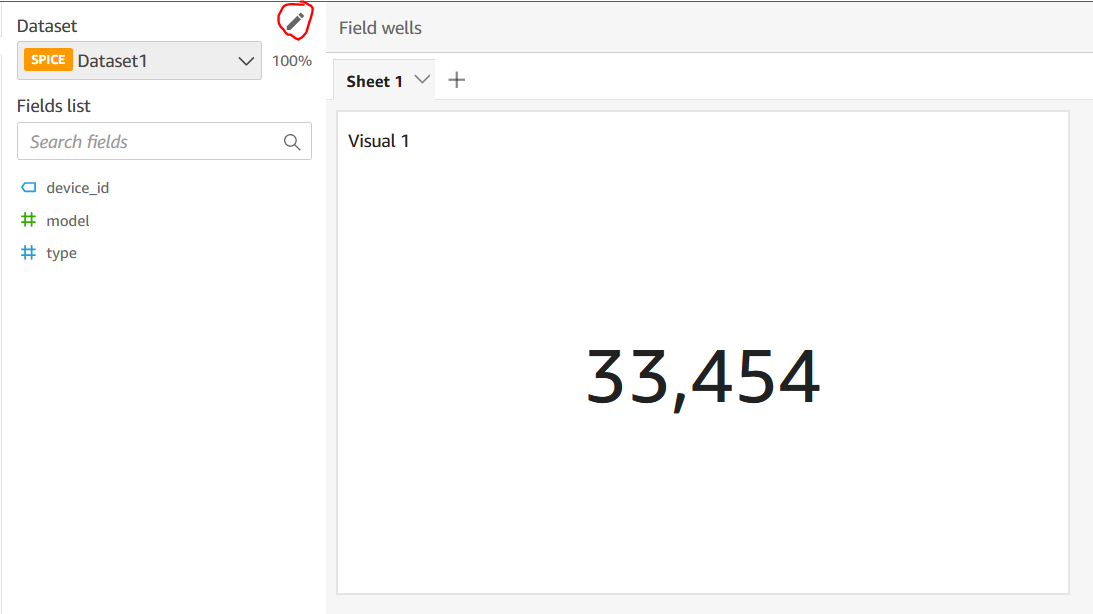
Yes it is possible, charts are called visuals on an analysis and the steps to create a visual from a completely separate dataset to the others is as easy as the following.

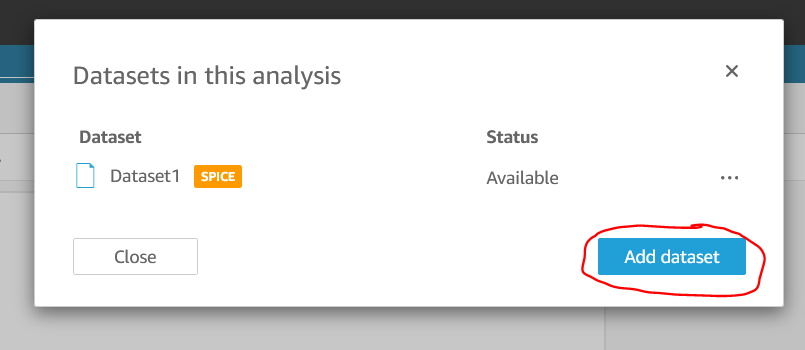
Click on the pencil icon in the dataset section Click the pencil icon in the dataset section

Click Add dataset Click Add dataset

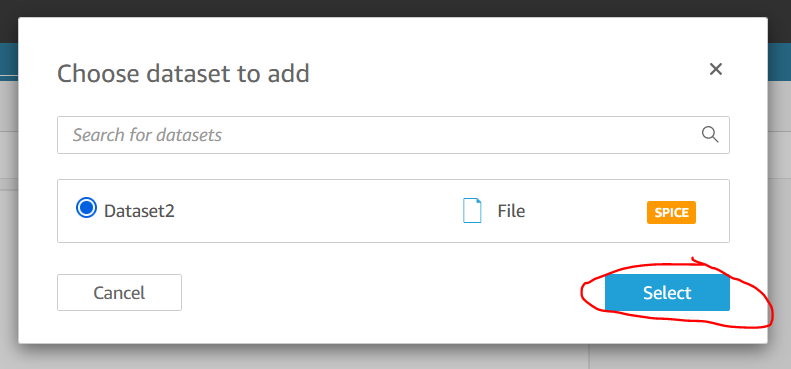
Select the dataset you want to make the new visual from Select the dataset you want to make the new visual from

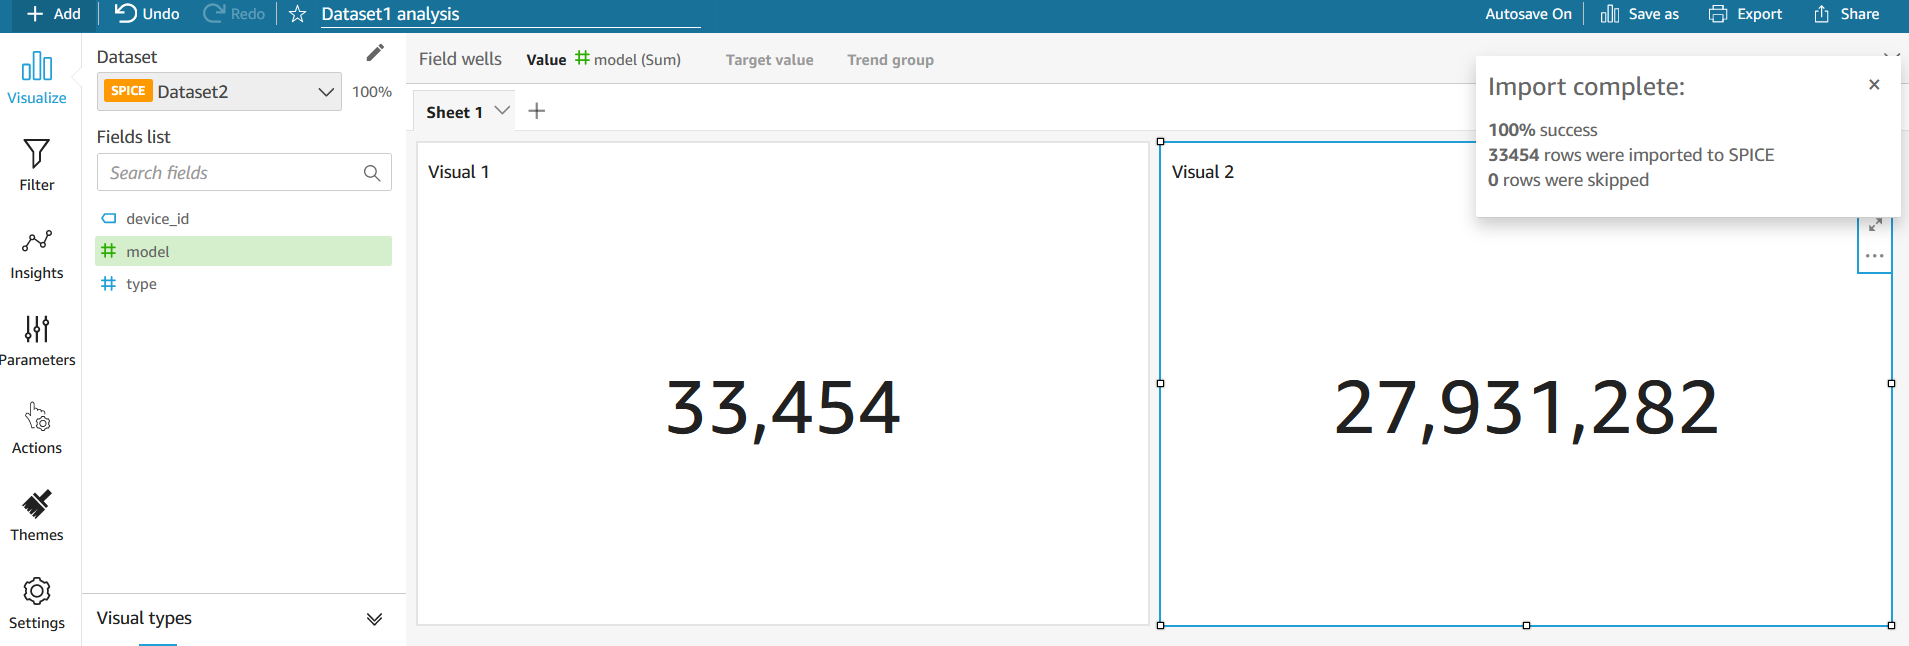
Make sure the dataset you want to use is selected in the drop-down in the dataset section (1) and click the add button in the top left corner (2) Make sure the dataset you wish to use is selected in the drop-down and click Add in the top left corner

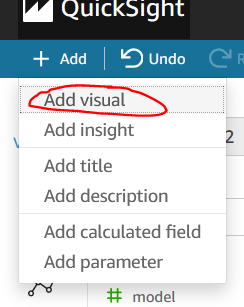
Click Add visual and create your visual as you would normally

Click Add visual

Now you have two visuals from distinct datasets in one analysis, this can be published and both visuals will be on the same dashboard Two visuals from distinct datasets

Poussin answered 8/12, 2021 at 9:5 Comment(0)

© 2022 - 2024 — McMap. All rights reserved.