I'm looking for a way to visualize the surface between a number of straight lines, which are defined in a dataframe through their intercepts and slopes. The surface I am looking for is the one that encloses the origin (0, 0).
The number of lines may vary (even though in the following simplified example I only have 6), and some of them may be redundant (i.e. they do not enclose the surface I am looking for because other lines are more constraining).
Let's take this simple dataframe:
df <- data.frame("Line" = c("A", "B", "C", "D", "E", "F"),
                 "Intercept" = c(4, 3, -2.5, -1.5, -5, -.5),
                 "Slope" = c(-1, 1, 2.4, -.6, -.8, .6))
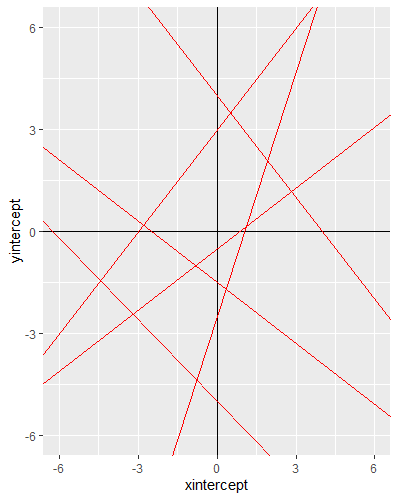
Plotting these lines with ggplot2:
ggplot(data = df) +
  geom_vline(xintercept = 0) +
  geom_hline(yintercept = 0) +
  geom_abline(mapping = aes(intercept = Intercept, slope = Slope),
              colour = "red") +
  coord_cartesian(xlim = c(-6, 6), ylim = c(-6, 6))
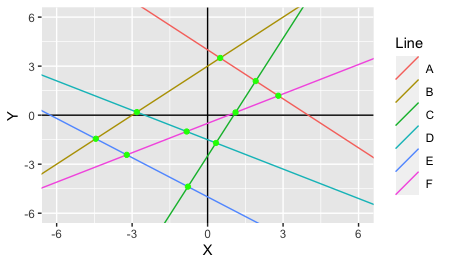
Gives me the following output:
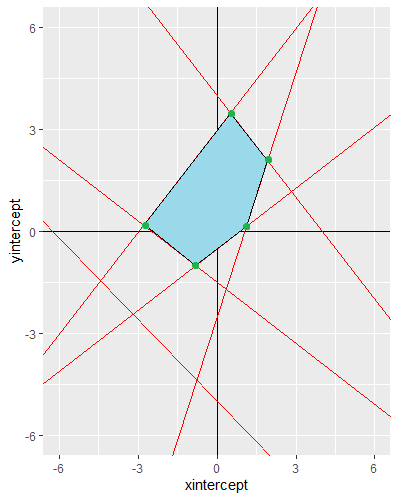
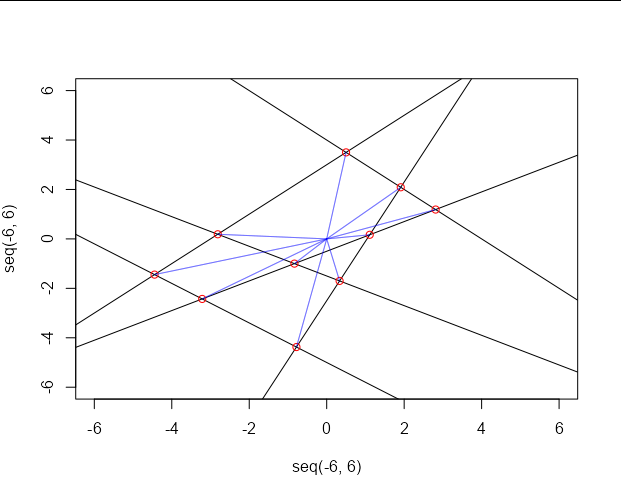
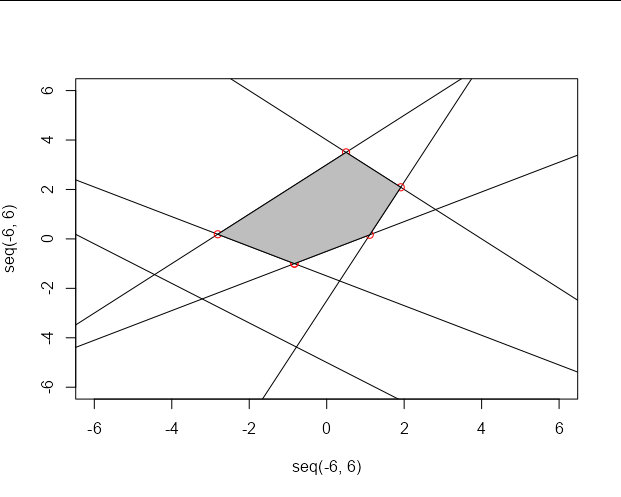
Basically I want to find intersections between the lines that enclose the origin (0, 0), disregarding the redundant one (the bottom left in this case, with intercept = -5 and slope = -0.8). Those 5 intersection points would then be used to plot the convex hull.
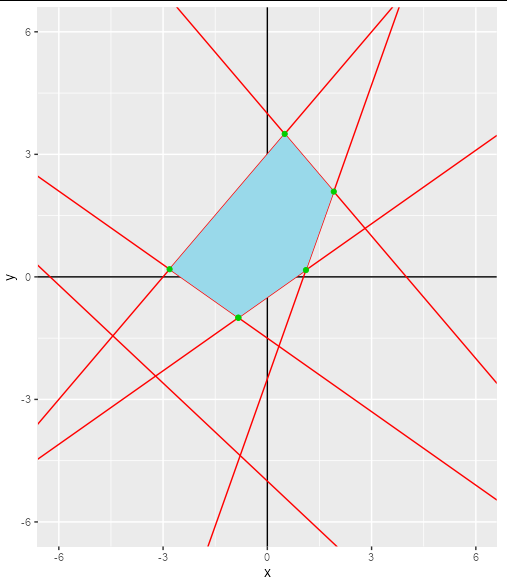
My main problem lies in finding the intersection points of the constraining lines (green points below) in order to be able to find the blue surface.
QUESTION: Any suggestions on how to deal with this in R, ideally in a way that can be extended to larger dataframes (including more constraining and redundant lines)?
ADDITIONAL QUESTION: geom_abline() does not have a group aesthetic similar to geom_line(), which could be used to identify the line. Does anyone know a workaround to draw straight lines in ggplot2 based on slopes and intercepts (or two user-defined points of the line)?
Thanks in advance for any suggestions or (parts of) potential solutions!
UPDATE: In order to center the polygon around point (a,b) instead of the origin (0, 0), I have amended the original code (in particular the ìnnermost()`-function from @AllanCameron as follows:
innermost <- function(slopes, intercepts, a, b) {

  meetings <- function(slopes, intercepts) {
    meets_at <- function(i1, s1, i2, s2) {
      ifelse(s1 - s2 == 0, NA, (i2 - i1)/(s1 - s2))
    }
    xvals <- outer(seq_along(slopes), seq_along(slopes), function(i, j) {
      meets_at(intercepts[i], slopes[i], intercepts[j], slopes[j])
    })

    yvals <- outer(seq_along(slopes), seq_along(slopes), function(i, j) {
      intercepts + slopes *
        meets_at(intercepts[i], slopes[i], intercepts[j], slopes[j])
    })

    cbind(x = xvals[lower.tri(xvals)], y = yvals[lower.tri(yvals)])

  }

  xy <- meetings(slopes, intercepts)
  xy[,1] <- xy[,1] - a
  xy[,2] <- xy[,2] - b

  is_cut <- function(x, y, slopes, intercepts, a, b) {
    d <- sqrt(x^2 + y^2)
    slope <- y / x
    xvals <- (intercepts + slopes*a - b) / (slope - slopes)
    yvals <- xvals * slopes + (intercepts + slopes*a - b)
    ds <- sqrt(xvals^2 + yvals^2)
    any(d - ds > 1e-6 & sign(xvals) == sign(x) & sign(yvals) == sign(y))
  }

  xy <- xy[sapply(seq(nrow(xy)), function(i) {
    !is_cut(xy[i, 1], xy[i, 2], slopes, intercepts, a, b)
  }),]

  xy <- xy[order(atan2(xy[,2], xy[,1])),]

  xy[,1] <- xy[,1] + a
  xy[,2] <- xy[,2] + b

  as.data.frame(rbind(xy, xy[1,]))
}

