How to find Cumulative Layout Shift problems if Page Speed Insights says one thing and Search Console says another
Asked Answered
H

3

8

With Cumulative Layout Shift (CLS) now a criteria of Page Speed Insights (PSI) and Google Search Console (GSC) I was wondering what method should be used in order to identify CLS if PSI returns a 0 value but Field Data returns a high value.

For example I have a page that scores 0 on PSI but gets 0.99 CLS for desktop (0 for mobile) according to Search Console.

Using Developer Tools I tried switching on paint flashing and switched on layout shift regions but still get 0 shift, whereas field data says 0.99.

So how do you identify what is causing a Layout Shift using developer tools?

Homs answered 6/7, 2020 at 7:46 Comment(2)
Did you ever get an answer to this? I have the same problem where FIELD data consistently shows a poor CLS (above 1.0) but the Lab Data consistently shows 0 CLS. This has been happening for months and months. How in the world do you debug what element(s) are triggering this issue in Field Data when the issue is not present in Lab Data?Breakage
My answer below was the way I managed to track it down as both performance trace and automated tests were not picking it up on my machine. Otherwise (and I would say first way to try and find the problem) is try the method suggested by @dnq if it isn't an intermittent problem.Homs
H
9

So as nobody has answered this I will put down what I did, it may not be the best way to do it so bear that in mind!

I opened dev tools and setup a new profile under network speed where the latency was 1000ms and the speed to 50kb/s. (where it says "online" next to "disable cache", click there and go to "Custom > "Add...").

This effectively gives you time to see what is happening on a page as resources load in.

I then went to the "rendering" tab and switched on "Paint Flashing", "Layout Shift Regions" and "Layer borders"

I then just watched the page load with this artificial slow down in place.

It was immediately obvious doing this that I had a side menu loading in via AJAX but when it loaded it was about 1px too wide due to a border on it so it made the whole main section shift to the left a tiny bit.

Impossible to notice with the naked eye but really obvious with the above method. This didn't happen on the automated tests as it was (sort of) a race condition in a browser that depended on load order (using async for scripts as I do other manipulation on the aside) and PSI was consistent.

I hope this helps someone until someone comes up with a better way of identifying the root cause of a Layout Shift.

Update

As pointed out in the comments make sure you test at different screen sizes as well.

Homs answered 21/7, 2020 at 19:25 Comment(2)
Also be sure to test all your different responsive widths / breakpoints. PSI is only testing one width for desktop and one for mobile. If your real users have different device widths that trigger a CLS layout issue, that could show up as a high CLS in Search Console / CrUX field data but not PSI.Prosthodontics
Added an extra line to account for this, thanks Chris!Homs
R
4

At the Developer tools, you can go to Performance > Record (the dot at the top). Then refresh the page by using a hard refresh (shift + refresh). NB: Best to make the developer tools sidebar as small as possible to simulate the correct browser size.

As the Developer tools is recording, you can scroll all the way down and stop the recording once you're at the bottom.

Resize the Developer tools tab, and a timeline will appear. This includes a section 'Web vitals'. At 'Experience', you will find blocks that indicate the Layout shifts.

If you hover over the Layout Shift box, the class will be visible in the webpage. You can even zoom in and hover over the timeline at the top, to see the layout at that specific time (and thus the difference in layout causing the layout shift).

If you click on the Layout Shift box, there's a summary in which you'll be able to see the changes e.g. 'Moved from Location [...], Size: [...x...]'

It takes some resizing between all the tabs in the Performance section, but for me, this is really helpful to find out what classes are causing these shifts! Hope this works for you as well.

Roger answered 12/2, 2021 at 15:44 Comment(0)
A
0

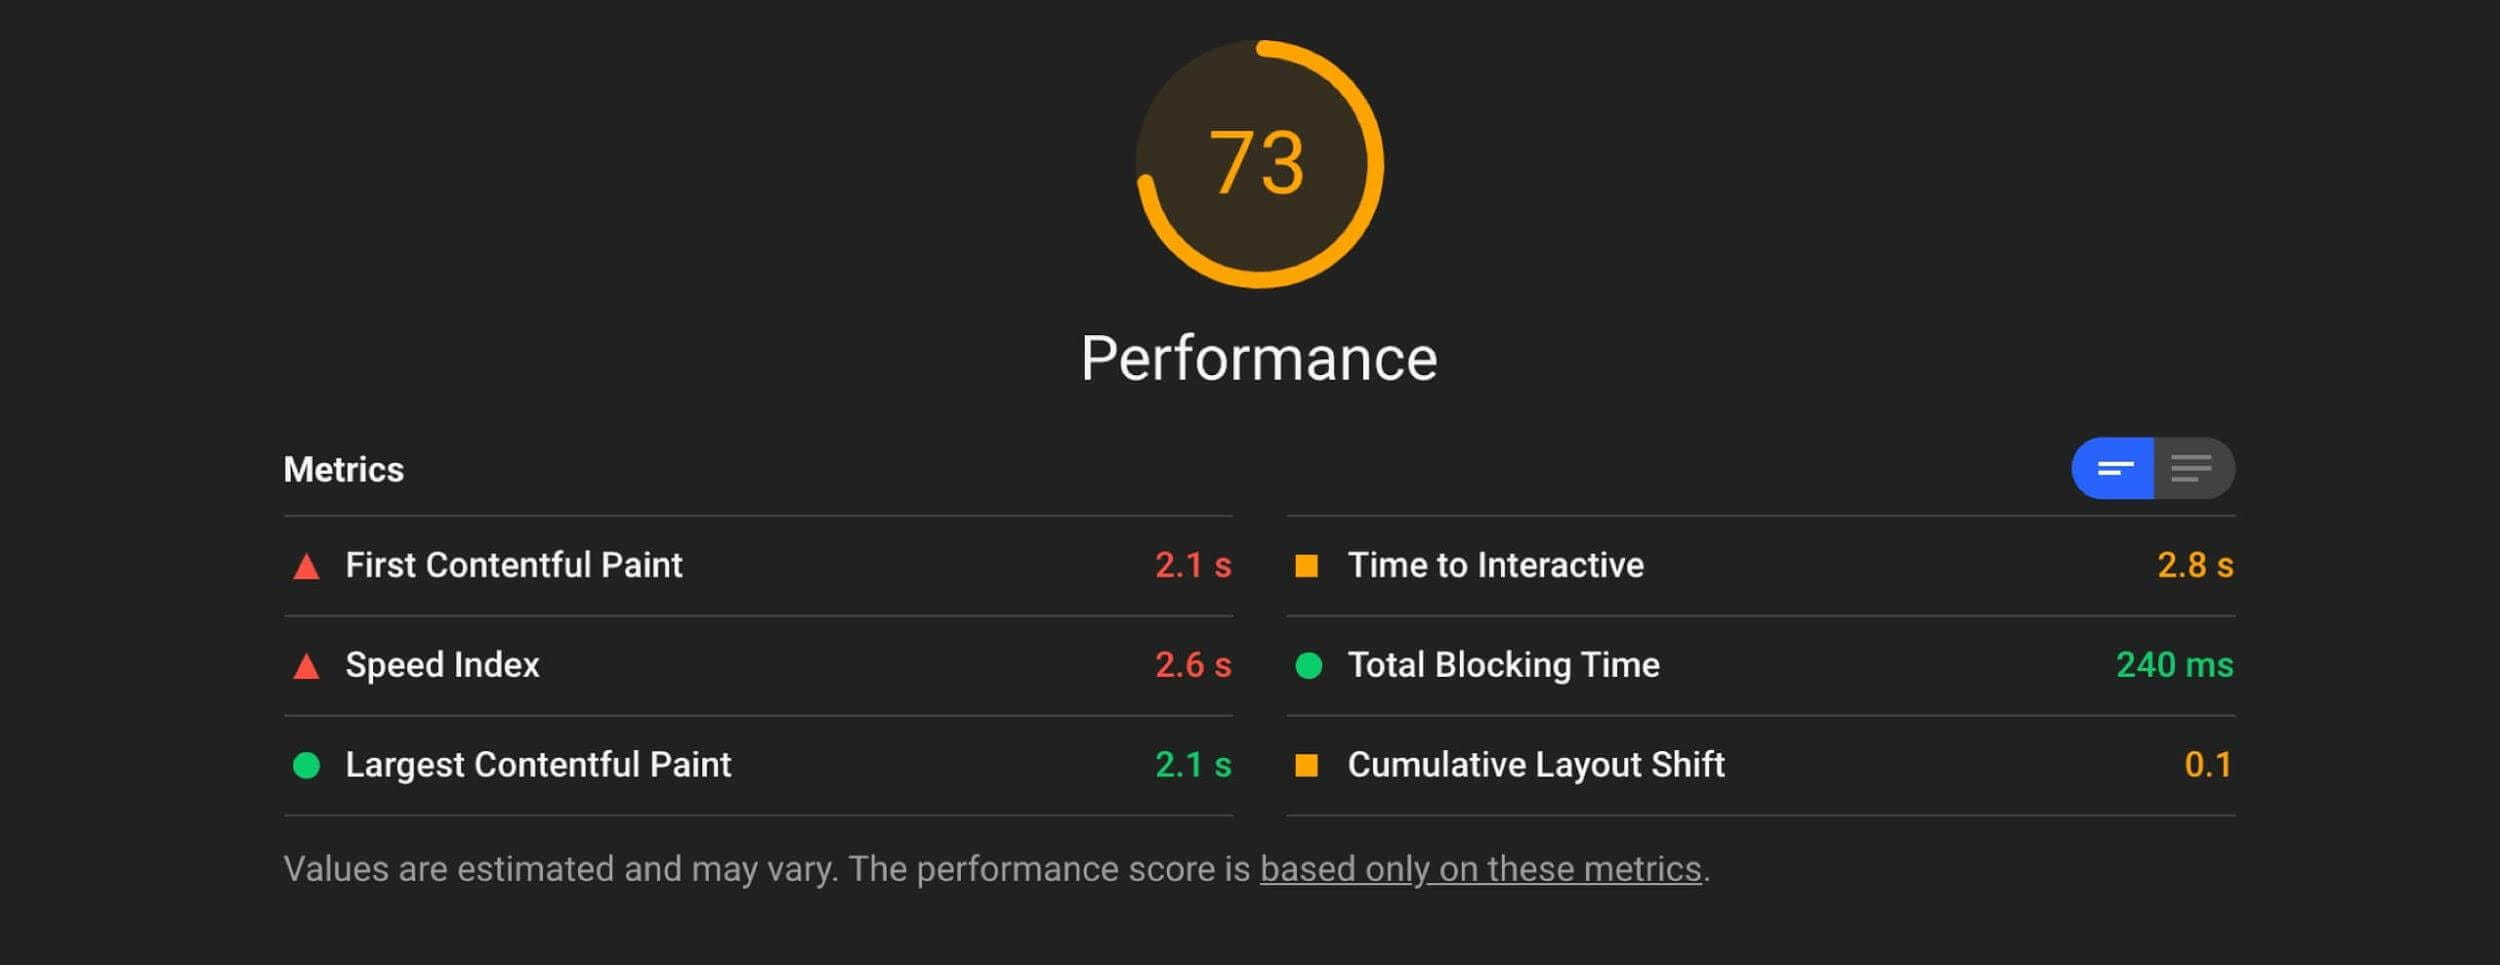
Chrome DevTools can give you CLS measure and help you to debug pain-points of your website through:

Lighthouse

enter image description here

Performance panel

enter image description here Red-tinted "Layout Shift" bar will drill you down into impacted elements


More read: https://web.dev/optimize-cls/

Adams answered 30/3, 2021 at 17:3 Comment(0)

© 2022 - 2024 — McMap. All rights reserved.