EDIT: Please see tom10's answer. His solution works by setting the values of the excluded part to np.nans.
It looks like matplotlib's plot_surface doesn't accept np.nans as coordinates, so that won't work either. If I understand your question correctly, then I have at least a duct tape solution to offer:
If instead of setting the "cut out" points to zero like MEVIS3000 suggests, you set them to the last value in that dimension, then your 2d arrays will all have same size and the surface will look like it cuts there.
I added some more data points to your example to make it clearer. This is the starting point (where the whole surface is visible):
import numpy as np
import matplotlib.pyplot as plt
from mpl_toolkits.mplot3d import Axes3D


X = np.array([[0, 1, 2, 3, 4, 5],
              [0, 1, 2, 3, 4, 5],
              [0, 1, 2, 3, 4, 5],
             ])
Y = np.array([[0, 0, 0, 0, 0, 0],
              [1, 1, 1, 1, 1, 1],
              [2, 2, 2, 2, 2, 2],
             ])
Z = np.array([[0.5, 0.4, 0.35, 0.32, 0.312, 0.3],
              [0.9, 0.7, 0.60, 0.55, 0.525, 0.5],
              [1.0, 1.1, 1.20, 1.30, 1.400, 1.5],
             ])


fig = plt.figure()
ax = fig.add_subplot(111, projection='3d')
ax.plot_surface(X,Y,Z)

plt.show()
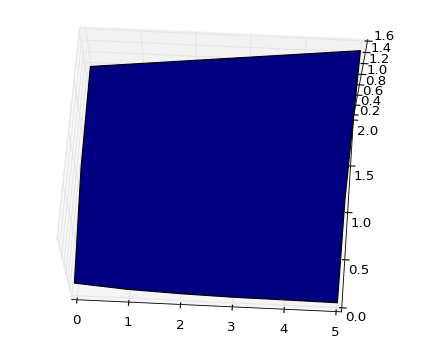
The resulting surface looks like this (from the upside):
![Pic 1: surface with original data]()
Now, if we adjust the arrays so that we replace the "missing" values with previous values in that row we can leave out a part of the surface:
X = np.array([[0, 1, 2, 2, 2, 2],  # Notice the sequence 0, 1, 2, 2, 2...
              [0, 1, 2, 3, 3, 3],  # Here starting from 3
              [0, 1, 2, 3, 4, 4],  # Here starting from 4
             ])
Y = np.array([[0, 0, 0, 0, 0, 0],  # Here we don't need to do anything
              [1, 1, 1, 1, 1, 1],
              [2, 2, 2, 2, 2, 2],
             ])
Z = np.array([[0.5, 0.4, 0.35, 0.35, 0.35, 0.35],  # Here like in X: repeats from 0.35
              [0.9, 0.7, 0.60, 0.55, 0.55, 0.55],
              [1.0, 1.1, 1.20, 1.30, 1.40, 1.40],
             ])
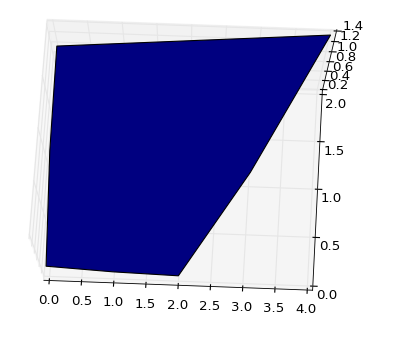
The resulting chart looks like this (again from the same view):
![Pic 2: lower right corner cut out]()
This is not a pretty fix, but it is one way to do it. I will leave you with the problem of automating the "cutoff" somehow.


