Does anyone have a method to adorn an R corrplot correlation plot with a dendrogram?
Dendrogram with Corrplot (R)
Asked Answered
I was so sad to not see any answers to this –
Digitigrade
...2 years after, still sad :( –
Digitigrade
@Sosi - if it cheers you up, I've added an answer. –
Catheryncatheter
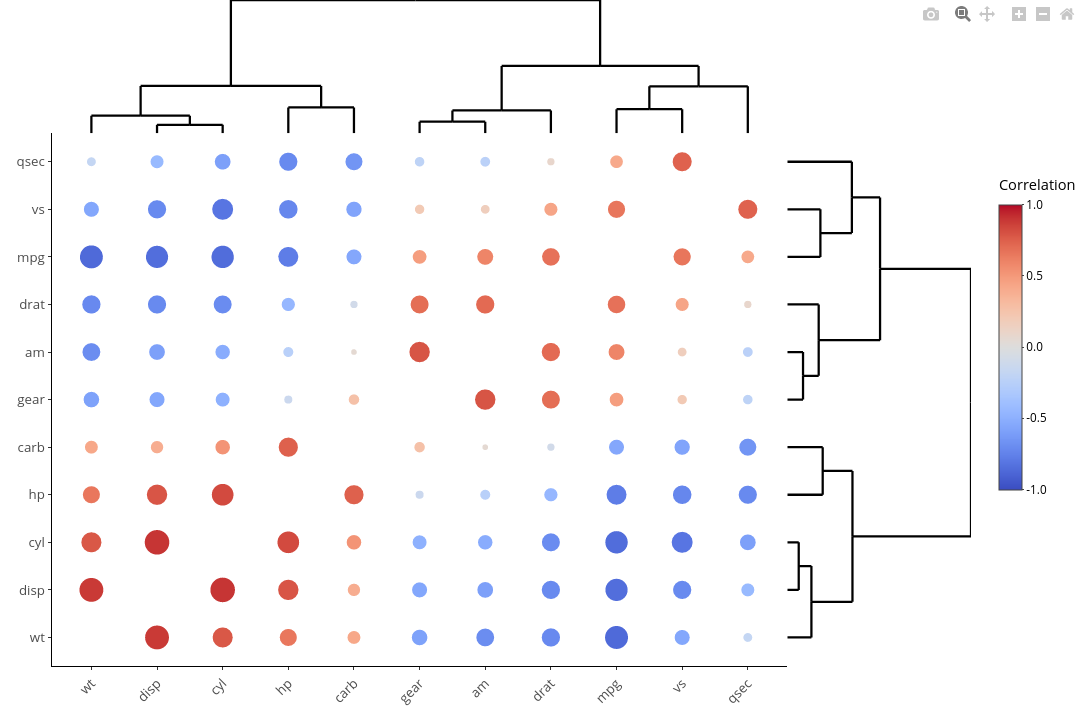
heatmaply actually has this functionality baked in since about December 2017! See the example below taken from the upcoming v1.0 vignette:
library("heatmaply")
r <- cor(mtcars)
## We use rcorr to calculate a matrix of p-values from correlation tests
library("Hmisc")
mtcars.rcorr <- rcorr(as.matrix(mtcars))
p <- mtcars.rcorr$P

heatmaply_cor(
  r,
  node_type = "scatter",
  point_size_mat = -log10(p),
  point_size_name = "-log10(p-value)",
  label_names = c("x", "y", "Correlation")
)
The closest solution I know of is to use a heatmap on a correlation matrix, for example you could also use gplots::heatmap.2.
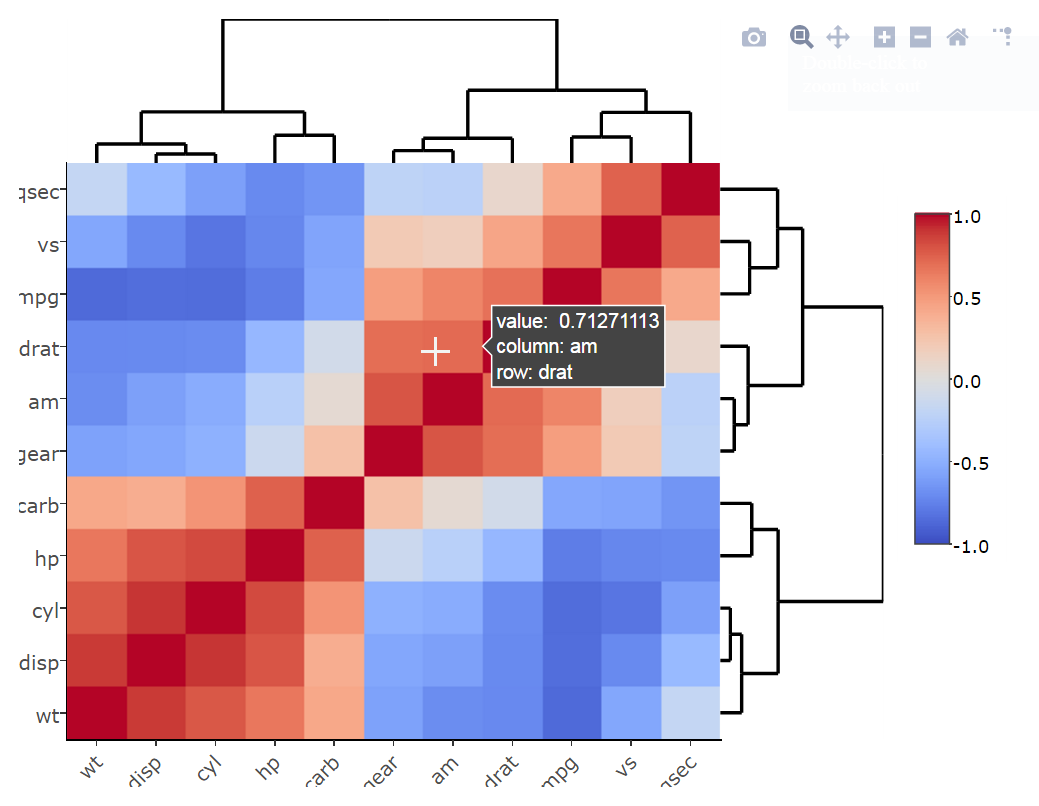
Here is how to do it using the heatmaply R package, which also offers an interactive interface where you can zoom-in and get a tooltip when hovering over the cells:
# for the first time:
# install.packages("heatmaply")

library(heatmaply)
my_cor <- cor(mtcars)
heatmaply_cor(my_cor)
Here is how it looks:
You can learn more about heatmaply in this vignette.
© 2022 - 2025 — McMap. All rights reserved.


