Android Studio Profiler Memory Allocated N/A
Asked Answered
I

2

8

Hi I am unable to view the allocated memory for my application when running the app on a real device/emulator, The profiler shows Allocated as N/A

below is the screenshot on how it looks,

enter image description here I am running android studio version 3.3.2, Is there anything else that needs to be configured.

Impale answered 2/6, 2019 at 18:43 Comment(0)
P
8

I had the same issue and here's what I did to make it work. (This is effective when running on API level < 26 only)

  1. In Android Studio, go to the Configurations menu as shown in the image below and click on Edit Configurations.

Edit Configurations menu

  1. Select your app configuration from the menu on the left (usually called "app").
  2. Click on the Profiling tab.
  3. Check "Enable advanced profiling".

Configurations Enable Advanced Profiling

Pacian answered 29/6, 2019 at 1:11 Comment(1)
This was the issue with the profiler. Since the device was running pre API 26, enabling this showed the allocate memory.Impale
A
6
  1. Enable advanced profiling. (If this solves the problem ignore the rest.) Edit configurations > app > Profiling > tick "Enable advanced profiling"
  2. In Android Studio, open the profiler view by clicking the profiler button.
  3. At the top of the view pane, to the right of "Sessions" click the dropdown menu and select "Memory".
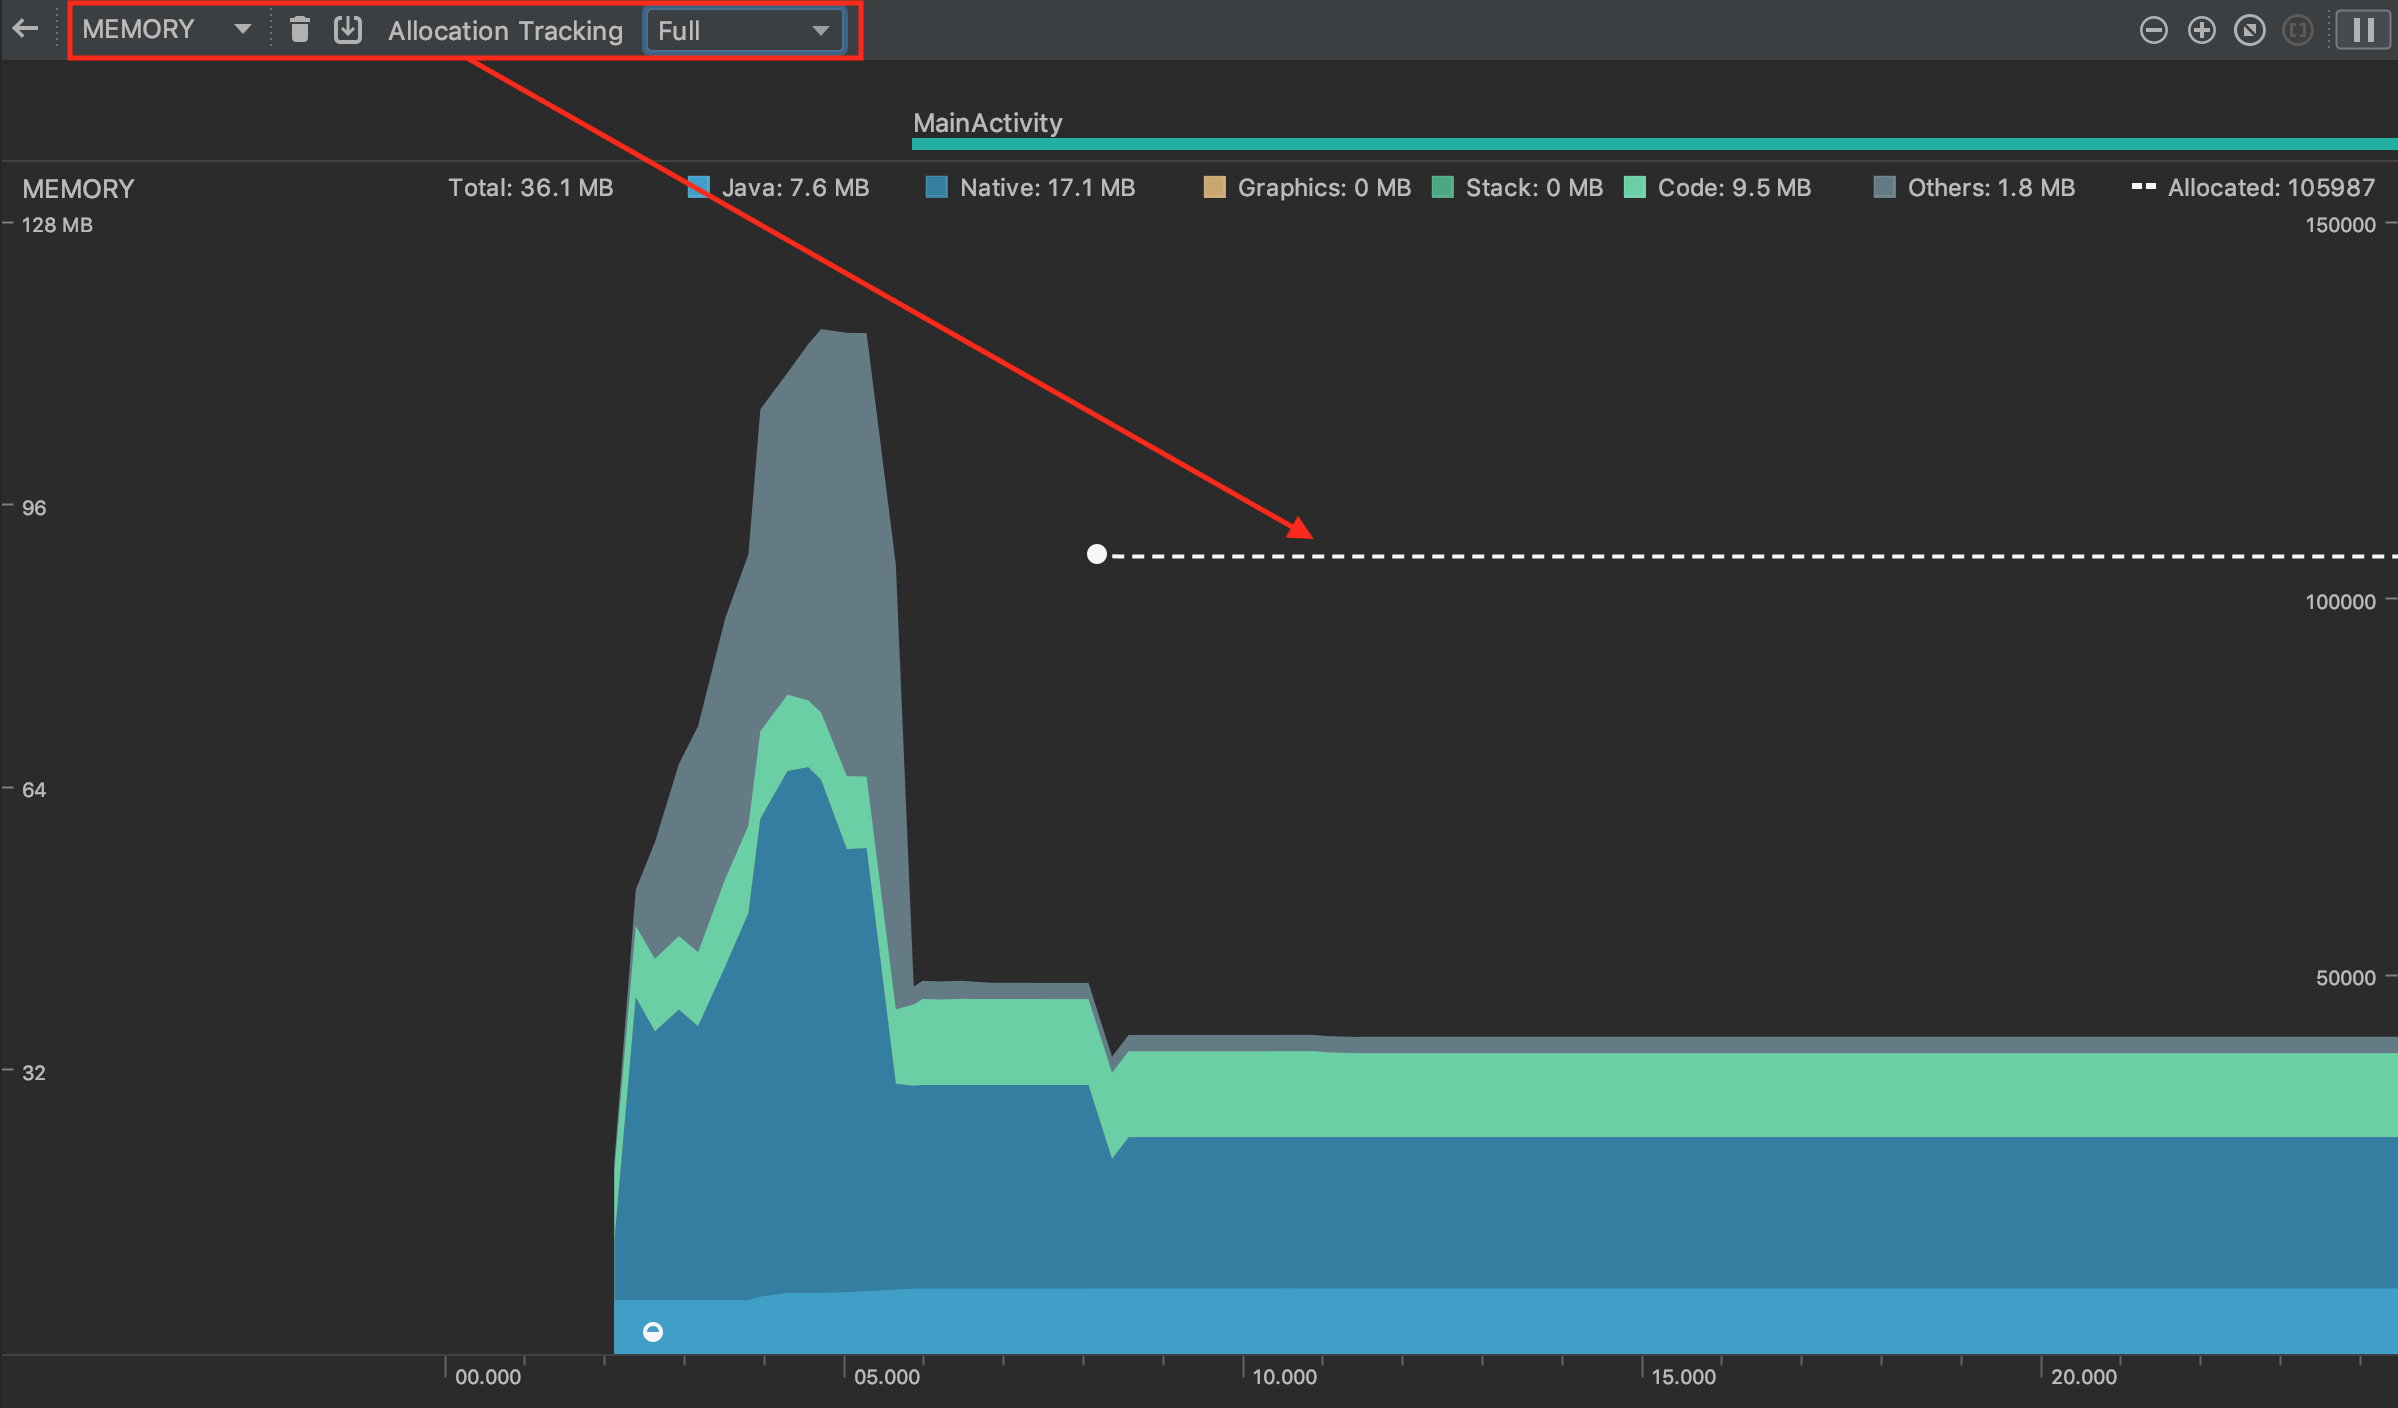
  4. To the right of the dropdown menu that now says "Memory" you will see "Allocation Tracking" and a dropdown menu next to it. Click it (while profiling!) and select "Full".

I hope this helped you.

enter image description here

EDIT: How my answer is better: It works on all Android devices!

Adviser answered 27/6, 2019 at 12:48 Comment(0)

© 2022 - 2024 — McMap. All rights reserved.