How to debug winforms designer
Asked Answered
T

5

8

My question is not how to debug during design time. I actually want to debug through the events available in designer. I know that the form has load and other type of events. Is there any events in windows forms designer like init, load, etc ?

I have done a similar debugging in ASP through user controls. It allows us to view the output HTML of a user control before adding it to the designer.

I know windows forms and ASP are different but there should be some event to check values of Controls before actually rendering it.

My Form takes a long time to open in the VS designer. So I attached a debugger to VisualStudio (devenv.exe), set a breakpoint in my Form’s InitializeComponent to step through it to see what the problem is. However, the breakpoint is not getting hit.

Telencephalon answered 20/5, 2016 at 12:51 Comment(3)
Walkthrough: Debugging Custom Windows Forms Controls at Design TimeBurcham
The designer classes are stored in System.Design.dll. It is part of the framework and is not built to support debugging. I suppose it is technically possible by deleting the ngen-ed file, re-ngen it with the /debug option and relying on the Reference Source for source code. Not that I would ever recommend that.Sikata
@HansPassant, Thanks I will give it a try. I mean if there is no other wayTelencephalon
T
1

Found a really old(almost 12 years) blog post through the following stack overflow question How does the Winforms Designer instantiate my form?

Blog: https://blogs.msdn.microsoft.com/rprabhu/2004/12/12/how-does-the-windows-forms-designer-in-visual-studio-load-a-form/

A quote from above blog that points me in the right direction

Well, the designer is not really instantiating Form1 at all. It is creating an instance of the base class of Form1

As per the above quote, follow the below steps and find the code that makes the designer slow

1) Create a class that extends Form and add it to your winforms project

public class DebuggableForm : Form
{
    public DebuggableForm()
    {
        //Put your code in InitializeComponent method here.
        //Through line-by-line debugging you can find 
        //which line is making the designer slow
    }
}

2) Extend the above class instead of directly extending Form in Form1.cs. Here Form1 is the name of a form, check the appropriate form name in your project

public class Form1: DebuggableForm
{
//Your actual form code
}

3) Place a breakpoint in the constructor of class created in step-1 (DebuggableForm)

4) Attach your project to another instance of VS and open a project in new VS

5) Open form1.cs in newly opened project and perform step-2 again.

6) Open the designer or double click on Form1 in solution explorer. Your debugger in DebuggableForm will be hit

Note: Form1.cs in above steps refer to a form in windows forms project. The name may vary in your project

Telencephalon answered 9/6, 2016 at 16:12 Comment(0)
B
8

To debug design-time of your windows forms project:

  • Right click on your project in solution explorer and open Properties.
  • In the property page select the Debug tab.
  • In the Start Action section, select Start external programand then click on button to browse for the Visual Studio executable file devenv.exe which is located in a path like "C:\Program Files (x86)\Microsoft Visual Studio 12.0\Common7\IDE\devenv.exe"
  • Save project and then run using F5. A new instance of visual studio will be opened.
  • Open the project using new instance. Which enables you to debug the previous instance of visual studio containing your project.
  • Put breakpoints in the files which you want to debug in instance.

When may I find this approach useful?

  • When you have an exception in design-time.
  • When you want to debug the behavior of a Designer or a TypeConverter or a UiTypeEditor at design time.

For more information:

Burcham answered 20/5, 2016 at 13:7 Comment(4)
There are no exceptions in any control. My designer freezes due to a time consuming control(about 30 mins). I'm not able to find what control is causing this problem so if I can debug designer I might be able to find the culpritTelencephalon
So you may find this approach useful. You don't need to debug dlls of designer and debugging the designer this way would be enough. Also make sure you know how the designer works. You may find this post and this one helpful.Burcham
did not work for me: as soon as the original VS instance was in run mode, all breakpoints get the hollow red circle with yellow triangular exclamation mark icon, saying, "no symbols have been loaded for this document" (normal debugging works fine). so when I open the designed in the spawned, debuggee instance, nothing happens in the running instance. yes I made sure that everything was built properly prior to starting, and opened the very same project in both instances.Fdic
@CeeMcSharpface It's pretty straightforward. But sometimes there may be a problem in Visual Studio cached files. So start by closing all VS instance, and cleaning bin and obj folders of your project. Then take a look at this post and clean Visual Studio designer cached assemblies. Then follow instruction of this post. Hope it helps :)Burcham
C
3

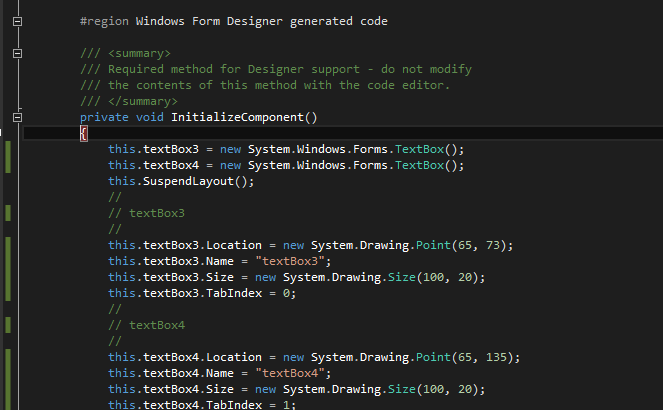
To debug in designer you need to put a breakpoint on top of designer code.

Then start your application and it will stop at the breakpoint.

Press F11 to move one line at the time.

enter image description here

Casiecasilda answered 20/5, 2016 at 12:57 Comment(1)
Thanks, I will give it a tryTelencephalon
T
2

enter image description here

Go to Tools → Options → Expand Debugging from left pane window → Enable Just my Code [Just Check off this checkbox] → OK.

Tanganyika answered 1/12, 2017 at 13:19 Comment(0)
E
1

You can debug Visual Studio using another instance of Visual Studio: https://mcmap.net/q/1324953/-attach-debugger-onto-another-visual-studio-instance

If you run into design time error and cannot recover the design view, you can open another visual studio and attached the current visual studio process for debugging.

Euh answered 20/5, 2016 at 13:13 Comment(0)
T
1

Found a really old(almost 12 years) blog post through the following stack overflow question How does the Winforms Designer instantiate my form?

Blog: https://blogs.msdn.microsoft.com/rprabhu/2004/12/12/how-does-the-windows-forms-designer-in-visual-studio-load-a-form/

A quote from above blog that points me in the right direction

Well, the designer is not really instantiating Form1 at all. It is creating an instance of the base class of Form1

As per the above quote, follow the below steps and find the code that makes the designer slow

1) Create a class that extends Form and add it to your winforms project

public class DebuggableForm : Form
{
    public DebuggableForm()
    {
        //Put your code in InitializeComponent method here.
        //Through line-by-line debugging you can find 
        //which line is making the designer slow
    }
}

2) Extend the above class instead of directly extending Form in Form1.cs. Here Form1 is the name of a form, check the appropriate form name in your project

public class Form1: DebuggableForm
{
//Your actual form code
}

3) Place a breakpoint in the constructor of class created in step-1 (DebuggableForm)

4) Attach your project to another instance of VS and open a project in new VS

5) Open form1.cs in newly opened project and perform step-2 again.

6) Open the designer or double click on Form1 in solution explorer. Your debugger in DebuggableForm will be hit

Note: Form1.cs in above steps refer to a form in windows forms project. The name may vary in your project

Telencephalon answered 9/6, 2016 at 16:12 Comment(0)

© 2022 - 2024 — McMap. All rights reserved.