Python Opencv - Cannot change pixel value of a picture
Asked Answered
N

4

8

Need to change the white pixels to black and black pixels to white of the picture given belowenter image description here

    import cv2

    img=cv2.imread("cvlogo.png")

A basic opencv logo with white background and resized the picture to a fixed known size

    img=cv2.resize(img, (300,300))#(width,height)


    row,col=0,0
    i=0

Now checking each pixel by its row and column positions with for loop

If pixel is white, then change it to black or if pixel is black,change it to white.

    for row in range(0,300,1):
        print(row)
        for col in range(0,300,1):
            print(col)
            if img[row,col] is [255,255,255] : #I have used == instead of 'is'..but there is no change 
                img[row,col]=[0,0,0]
            elif img[row,col] is [0,0,0]:
                img[row,col]=[255,255,255]

There is no error in execution but it is not changing the pixel values to black or white respectively. More over if statement is also not executing..Too much of confusion..

    cv2.imshow('img',img)
    cv2.waitKey(0)
    cv2.destroyAllWindows()
Nevers answered 10/8, 2017 at 12:18 Comment(0)
N
3

This is also a method of solving this problem. CREDITS:ajlaj25

    import cv2


    img=cv2.imread("cvlogo.png")
    img=cv2.resize(img, (300,300))
    height, width, channels = img.shape

    print(height,width,channels)

    for x in range(0,width):
        for y in range(0,height):
            if img[x,y,0] == 255 and img[x,y,1] == 255 and img[x,y,2] == 255:            
                img[x,y,0] = 0
                img[x,y,1] = 0
                img[x,y,2] = 0

            elif img[x,y,0] == 0 and img[x,y,1] == 0 and img[x,y,2] == 0:
                img[x,y,0] = 255
                img[x,y,1] = 255
                img[x,y,2] = 255

img[x,y] denotes the channel values - all three: [ch1,ch2,ch3] - at the x,y coordinates. img[x,y,0] is the ch1 channel's value at x,y coordinates. **

x and y denotes pixels location not RGB values of pixel .So, img[x,y,0] is the ch1 channel's value at x,y coordinates

**

    cv2.imshow('Coverted Image',img)
    cv2.waitKey(0)
    cv2.destroyAllWindows()
Nevers answered 12/8, 2017 at 13:41 Comment(0)
M
6

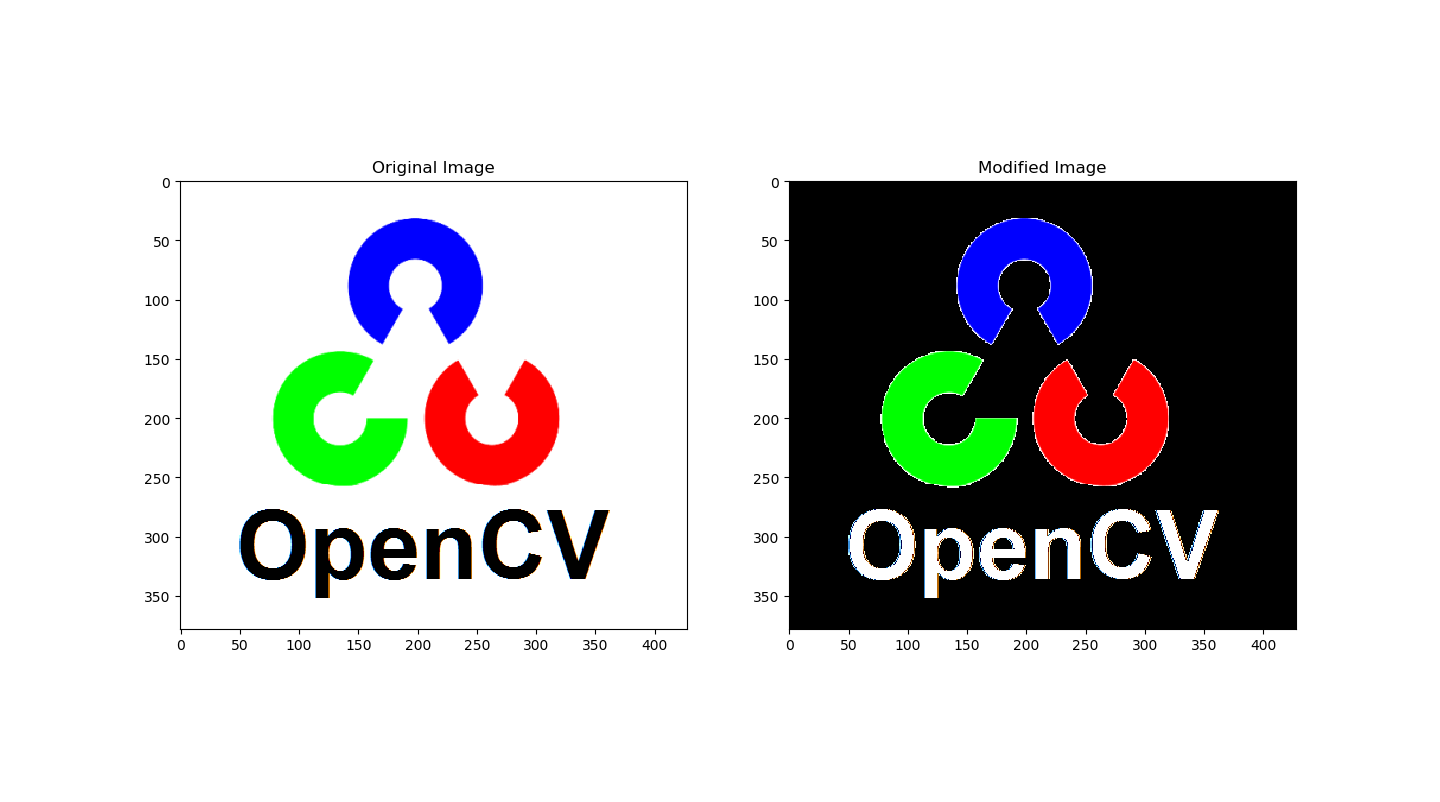
I am not very experienced, but I would do it using numpy.where(), which is faster than the loops.

import cv2
import numpy as np
import matplotlib.pyplot as plt

# Read the image
original_image=cv2.imread("cvlogo.png")
# Not necessary. Make a copy to plot later
img=np.copy(original_image)

#Isolate the areas where the color is black(every channel=0) and white (every channel=255)
black=np.where((img[:,:,0]==0) & (img[:,:,1]==0) & (img[:,:,2]==0))
white=np.where((img[:,:,0]==255) & (img[:,:,1]==255) & (img[:,:,2]==255))

#Turn black pixels to white and vice versa
img[black]=(255,255,255)
img[white]=(0,0,0)

# Plot the images
fig=plt.figure()
ax1 = fig.add_subplot(1,2,1)
ax1.imshow(original_image)
ax1.set_title('Original Image')
ax2 = fig.add_subplot(1,2,2)
ax2.imshow(img)
ax2.set_title('Modified Image')
plt.show()

enter image description here

Multiracial answered 28/10, 2019 at 19:36 Comment(0)
D
5

I think this should work. :) (I used numpy just to get width and height values - you dont need this)

import cv2

img=cv2.imread("cvlogo.png")
img=cv2.resize(img, (300,300))
height, width, channels = img.shape

white = [255,255,255]
black = [0,0,0]

for x in range(0,width):
    for y in range(0,height):
        channels_xy = img[y,x]
        if all(channels_xy == white):    
            img[y,x] = black

        elif all(channels_xy == black):
            img[y,x] = white

cv2.imshow('img',img)
cv2.waitKey(0)
cv2.destroyAllWindows()
Defraud answered 10/8, 2017 at 12:40 Comment(10)
well ! Its Working ! But can you spot the error in my code.Nevers
And what is this line denotes " if img[x,y,0] == 255 and img[x,y,1] == 255 and img[x,y,2] == 255:"Nevers
- I am not sure still new to python :D - but the problem with your code was that you never get inside your if condition. I think you can not test equality like you did (e.g.: [x, y, z] == [255, 255, 255]). I check equality for every channel separately. I hope that is the right answer.Defraud
img[x,y] denotes the channel values - all three: [ch1,ch2,ch3] - at the x,y coordinates. img[x,y,0] is the ch1 channel's value at x,y coordinates.Defraud
:) Thanks but I really cannot understand the concept of separating the channels .. if u can explain its helpful else share any link regarding this.Nevers
Now I can understand bro .. Thanks! wishes!Nevers
Numpy is not need here where img.shape is a class of cv2 module @DefraudNevers
Oh, you are right! So I read about this issue. If you are testing two arrays with more than one elements e.g.: x = np.array([1,2,3]) y = np.array([1,4,5]) x == y it returns array([ True, False, False], dtype=bool) and that is why we have any() and all(). if any( x==y) returns True, than one of the elements are equal. if all( x==y ) returns True, than all of the elements are equal. I hope its clear :) - I will edit the code!Defraud
Yup! I got the thing what u r saying! Well Understood!Nevers
Hello! Do u changed the answer? @Defraud ...all(channels==color) represent all 3 channels right?Nevers
N
3

This is also a method of solving this problem. CREDITS:ajlaj25

    import cv2


    img=cv2.imread("cvlogo.png")
    img=cv2.resize(img, (300,300))
    height, width, channels = img.shape

    print(height,width,channels)

    for x in range(0,width):
        for y in range(0,height):
            if img[x,y,0] == 255 and img[x,y,1] == 255 and img[x,y,2] == 255:            
                img[x,y,0] = 0
                img[x,y,1] = 0
                img[x,y,2] = 0

            elif img[x,y,0] == 0 and img[x,y,1] == 0 and img[x,y,2] == 0:
                img[x,y,0] = 255
                img[x,y,1] = 255
                img[x,y,2] = 255

img[x,y] denotes the channel values - all three: [ch1,ch2,ch3] - at the x,y coordinates. img[x,y,0] is the ch1 channel's value at x,y coordinates. **

x and y denotes pixels location not RGB values of pixel .So, img[x,y,0] is the ch1 channel's value at x,y coordinates

**

    cv2.imshow('Coverted Image',img)
    cv2.waitKey(0)
    cv2.destroyAllWindows()
Nevers answered 12/8, 2017 at 13:41 Comment(0)
Q
1

A bit late, but I'd like to contribute with another approach to solve this situation. My approach is based on image indexation, which are faster than looping through the image as the approach used in the accept answer.

I did some time measurement of both codes to illustrate what I just said. Take a look at the code below:

import cv2
from matplotlib import pyplot as plt

# Reading image to be used in the montage, this step is not important
original = cv2.imread('imgs/opencv.png')

# Starting time measurement
e1 = cv2.getTickCount()

# Reading the image
img = cv2.imread('imgs/opencv.png')

# Converting the image to grayscale
imgGray = cv2.cvtColor(img,cv2.COLOR_BGR2GRAY)

# Converting the grayscale image into a binary image to get the whole image
ret,imgBinAll = cv2.threshold(imgGray,175,255,cv2.THRESH_BINARY)

# Converting the grayscale image into a binary image to get the text
ret,imgBinText = cv2.threshold(imgGray,5,255,cv2.THRESH_BINARY)

# Changing white pixels from original image to black
img[imgBinAll == 255] = [0,0,0]

# Changing black pixels from original image to white
img[imgBinText == 0] = [255,255,255]

# Finishing time measurement
e2 = cv2.getTickCount()
t = (e2 - e1)/cv2.getTickFrequency()
print(f'Time spent in seconds: {t}')

At this point I stopped timing because the next step is just to plot the montage, the code follows:

# Plotting the image
plt.subplot(1,5,1),plt.imshow(original)
plt.title('original')
plt.xticks([]),plt.yticks([])
plt.subplot(1,5,2),plt.imshow(imgGray,'gray')
plt.title('grayscale')
plt.xticks([]),plt.yticks([])
plt.subplot(1,5,3),plt.imshow(imgBinAll,'gray')
plt.title('binary - all')
plt.xticks([]),plt.yticks([])
plt.subplot(1,5,4),plt.imshow(imgBinText,'gray')
plt.title('binary - text')
plt.xticks([]),plt.yticks([])
plt.subplot(1,5,5),plt.imshow(img,'gray')
plt.title('final result')
plt.xticks([]),plt.yticks([])
plt.show()

That is the final result:

Montage showing all steps of the proposed approach

And this is the time consumed (printed in the console):

Time spent in seconds: 0.008526025

In order to compare both approaches I commented the line where the image is resized. Also, I stopped timing before the imshow command. These were the results:

Time spent in seconds: 1.837972522

Final result of the looping approach

If you examine both images you'll see some contour differences. Sometimes when you are working with image processing, efficiency is key. Therefore, it is a good idea to save time where it is possible. This approach can be adapted for different situations, take a look at the threshold documentation.

Quest answered 19/1, 2019 at 11:39 Comment(0)

© 2022 - 2024 — McMap. All rights reserved.