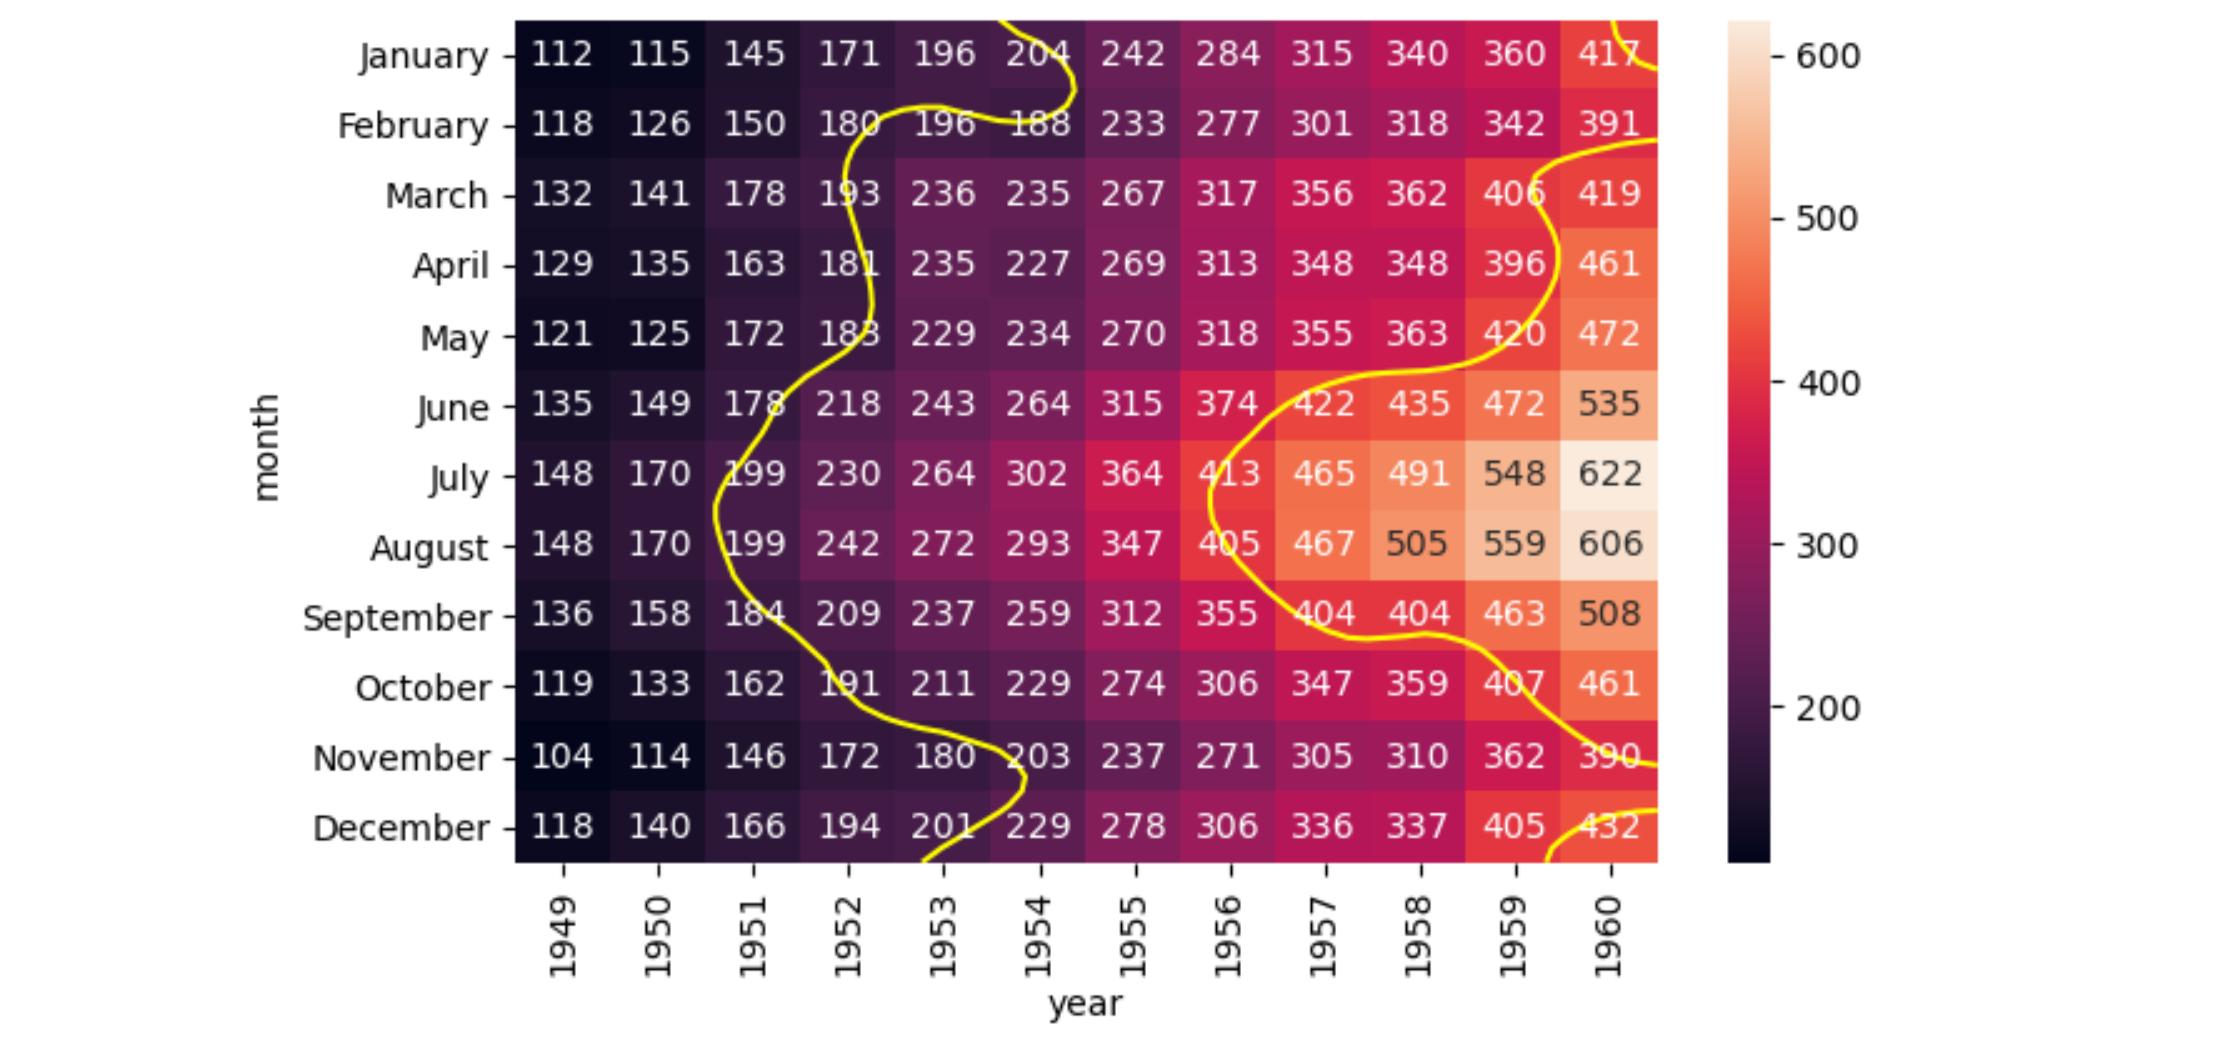
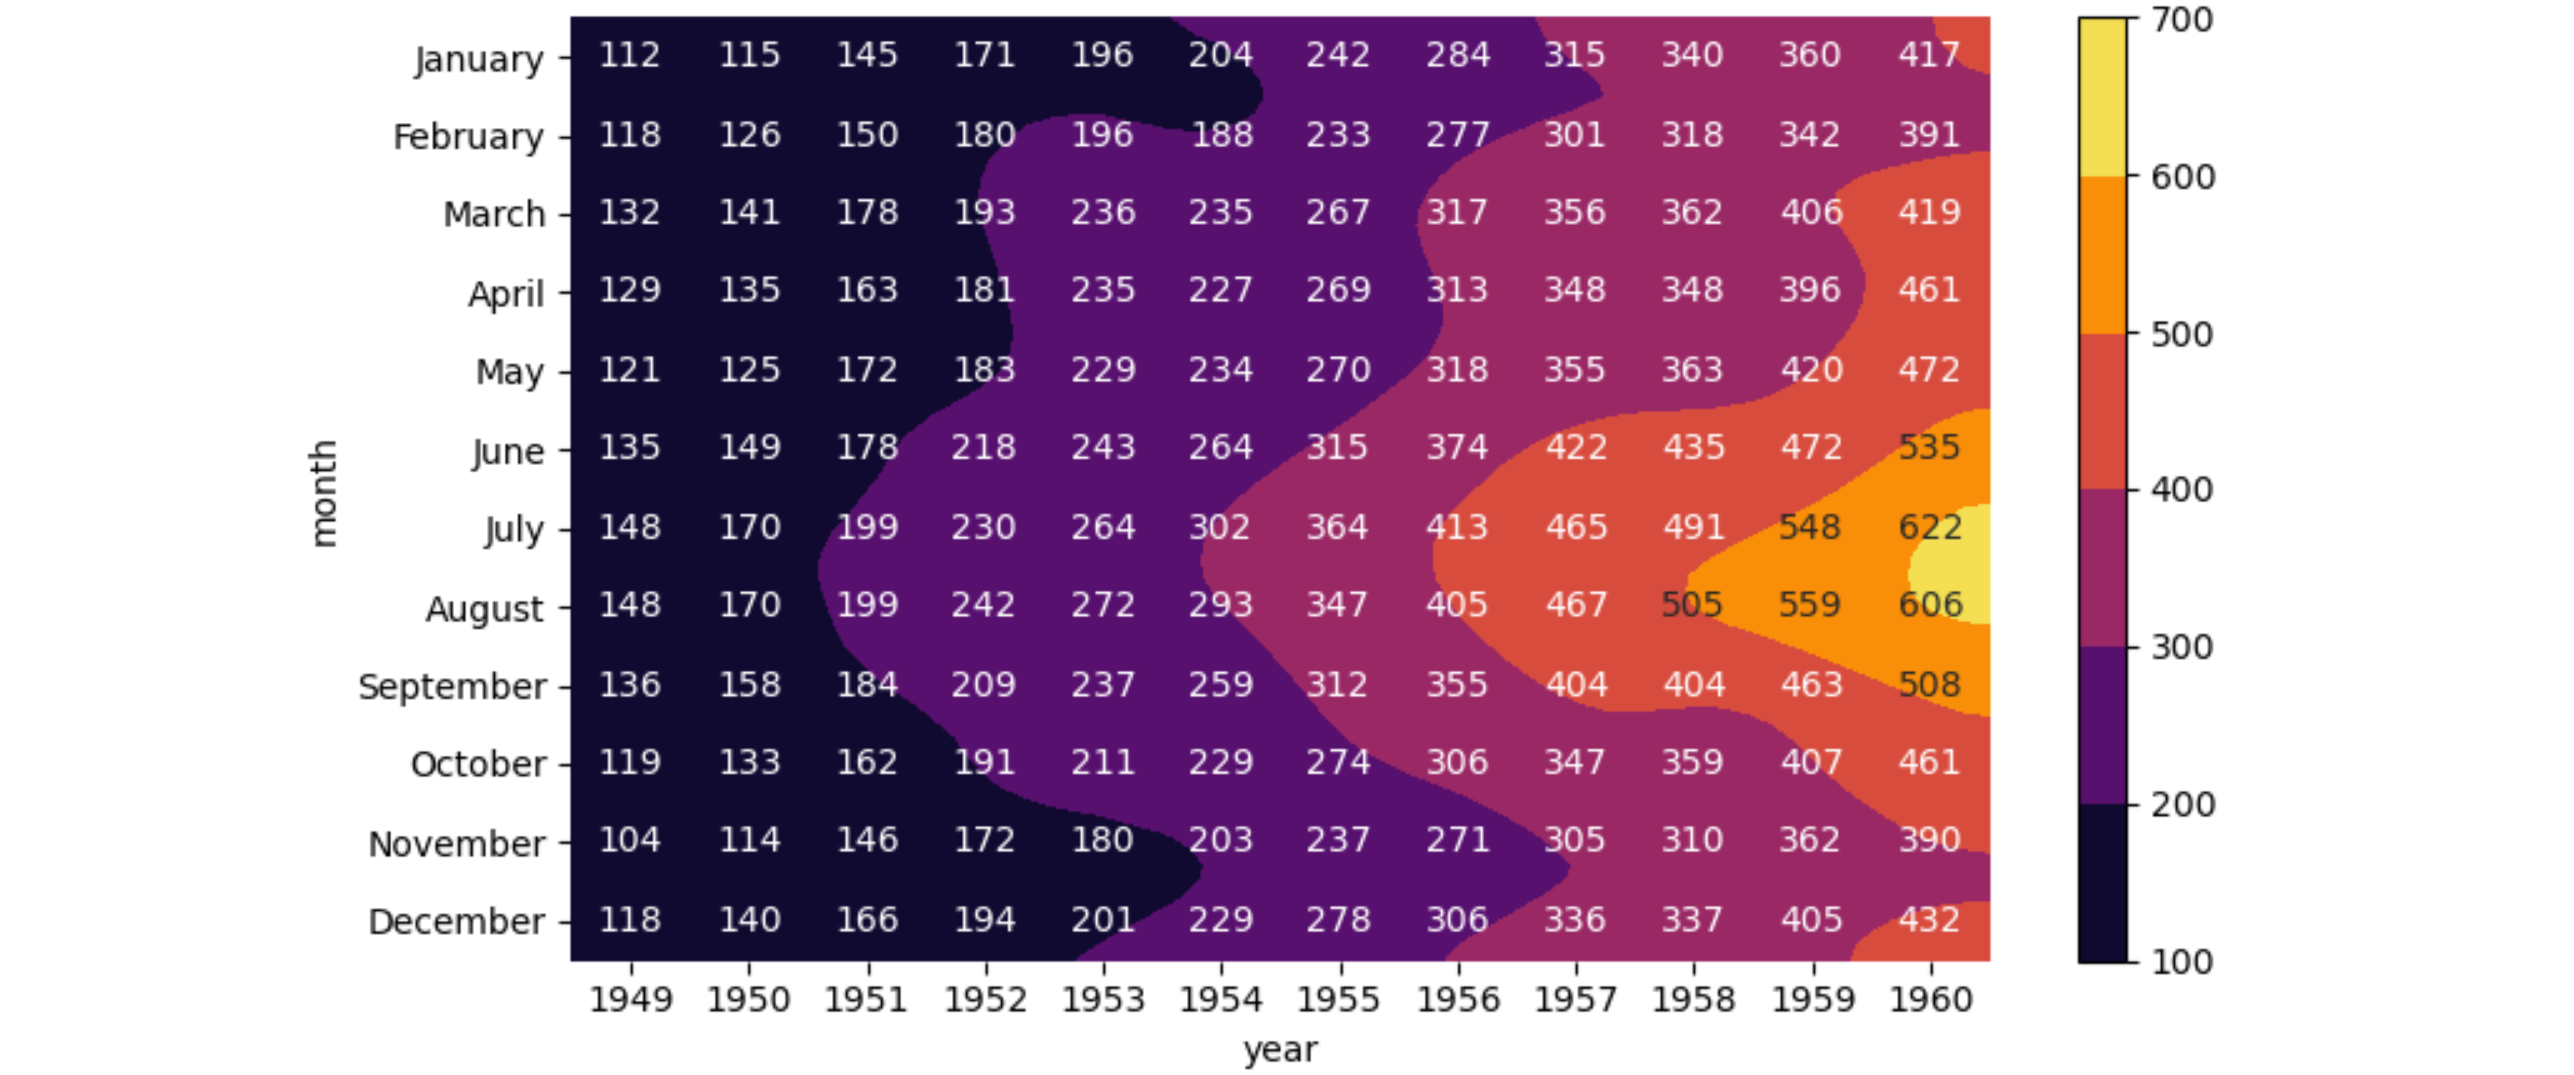
Is there a way to automatically add contour (iso-z) lines to a heatmap with concrete x and y values?
Please consider the official seaborn flights dataset:
import seaborn as sns
flights = sns.load_dataset("flights")
flights = flights.pivot("month", "year", "passengers")
sns.heatmap(flights, annot=True, fmt='d')
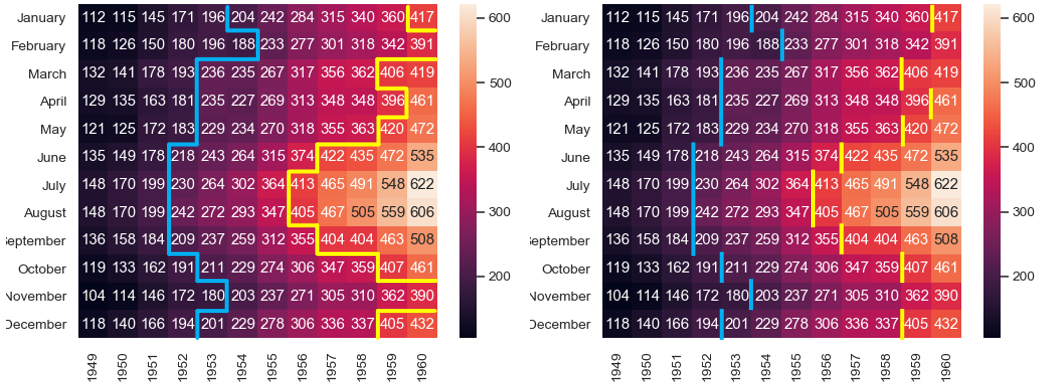
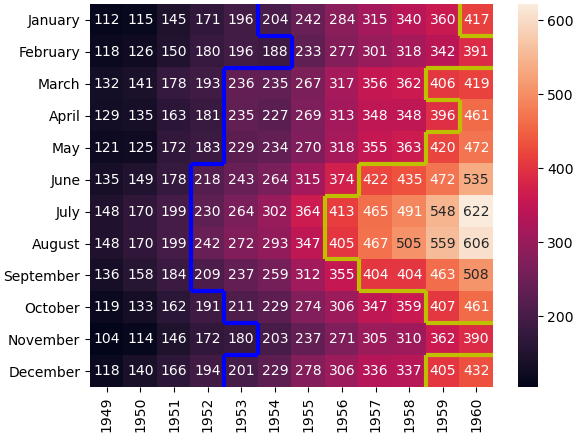
I imagine the step-like lines to look something like shown below (lhs), indicating thresholds (here 200 and 400). They do not need to be interpolated or smoothed in any way, although that would do as well, if easier to realize.
If the horizontal lines complicate the solution further, they too could be omitted (rhs).
So far, I have tried to add hlines and vlines manually, to overlay a kdeplot etc. without the desired result. Could somebody hint me into the right direction?


np.argwhere(v.T)are False, thennp.vstack((vlines, hlines))would return a dimension error – Saire