I'm developing a 2D plane finite element tool. One of the features is the ability to visualize the stresses on a particular object.
This tool creates a quadrilateral mesh using the following data:
nodes: numpy array
[[x1 y1], [x2 y2], etc]->xandycoordinates of every node in the meshelements: numpy array
[[1 2 3 4], [2 3 5 6]]-> every line of the array corresponds to the 4 points of one particular element of the mesh.
I was able to implement a method that plots the mesh:
import matplotlib.pyplot as plt
import matplotlib.collections
import matplotlib.cm as cm

import numpy as np


def showMeshPlot(nodes, elements):

    y = nodes[:,0]
    z = nodes[:,1]

    #https://mcmap.net/q/1324382/-matplotlib-unstructered-quadrilaterals-instead-of-triangles
    def quatplot(y,z, quatrangles, ax=None, **kwargs):

        if not ax: ax=plt.gca()
        yz = np.c_[y,z]
        verts= yz[quatrangles]
        pc = matplotlib.collections.PolyCollection(verts, **kwargs)
        ax.add_collection(pc)
        ax.autoscale()

    plt.figure()
    plt.gca().set_aspect('equal')

    quatplot(y,z, np.asarray(elements), ax=None, color="crimson", facecolor="None")
    if nodes:
        plt.plot(y,z, marker="o", ls="", color="crimson")

    plt.title('This is the plot for: quad')
    plt.xlabel('Y Axis')
    plt.ylabel('Z Axis')


    plt.show()

nodes = np.array([[0,0], [0,0.5],[0,1],[0.5,0], [0.5,0.5], [0.5,1], [1,0],
                  [1,0.5],[1,1]])
elements = np.array([[0,3,4,1],[1,4,5,2],[3,6,7,4],[4,7,8,5]])
stresses = np.array([1,2,3,4])

showMeshPlot(nodes, elements)
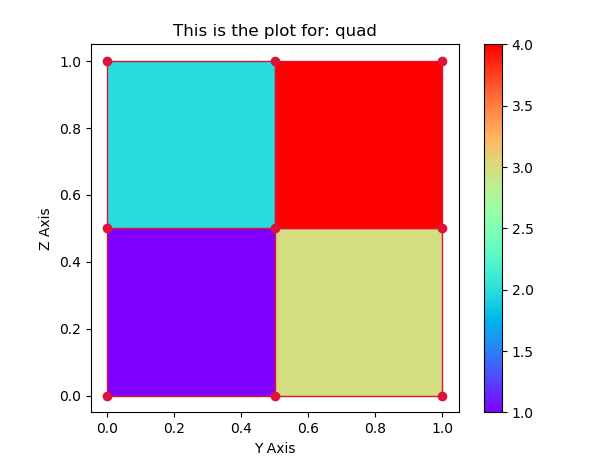
Which produces a plot like this:
Now, i have an 1D array with the stresses on the object, with the same length as the elements array.
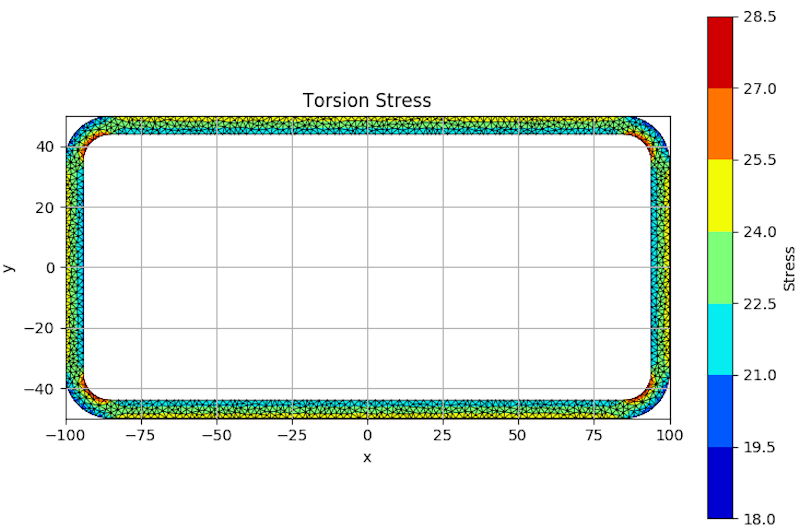
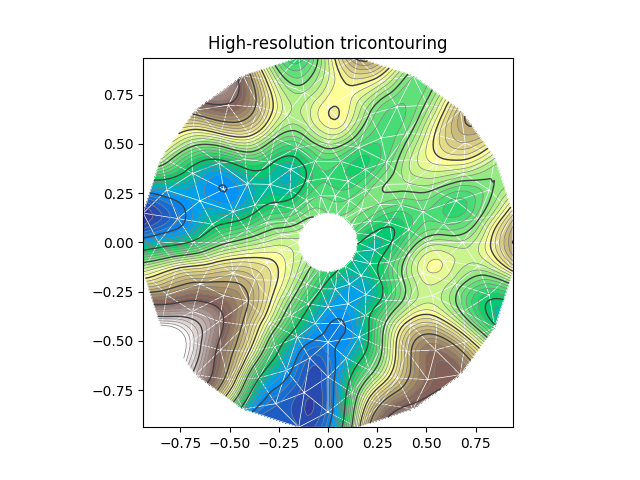
My question is how can i visualize those stresses (with a scalar bar) using matplotlib? I looked into pcolormesh, but i couldn't understand how it could work with my data. Here's an example of what i want to achieve (credits to robbievanleeuwen):
Note: I couldn't replicate the above example because he uses a triangular mesh instead of quads.
Thanks in advance!


stressin the code and the code is in general not runnable, which makes it hard to give an answer here. The broad idea here is of course to supply a colormap, a norm and an array to the PolyCollection and create a colorbar for that PolyCollection. – Jitterbug