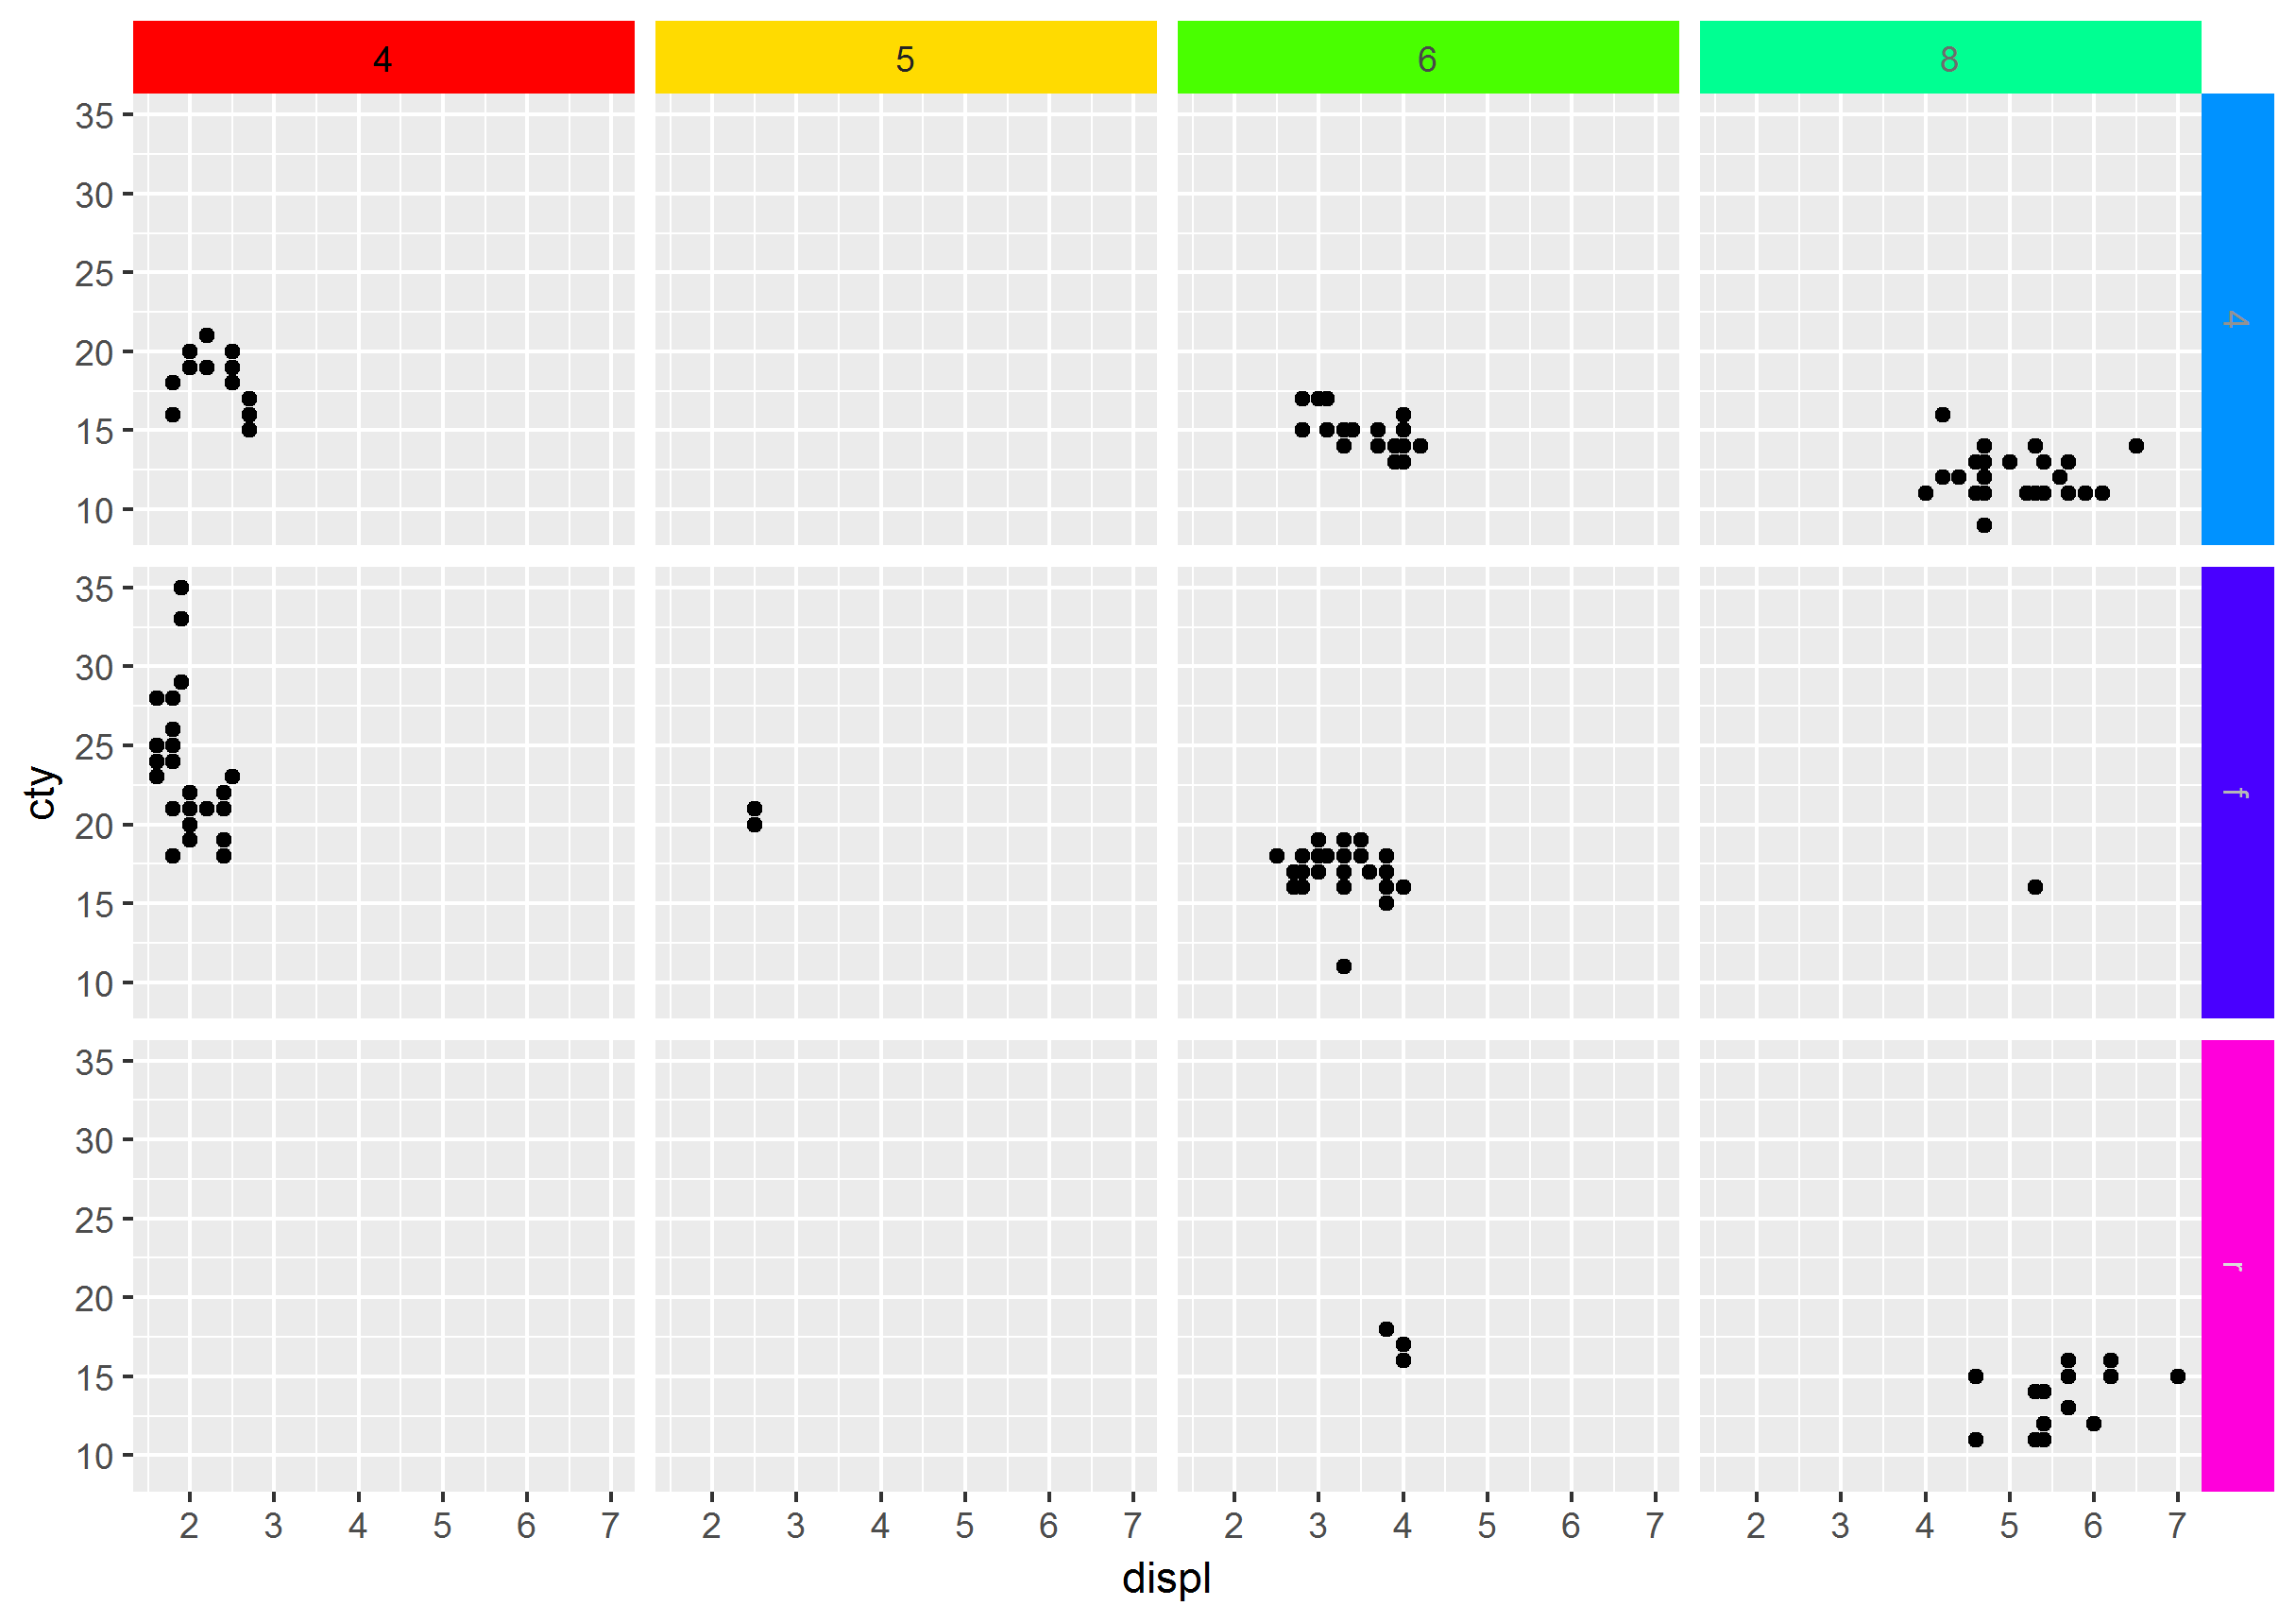
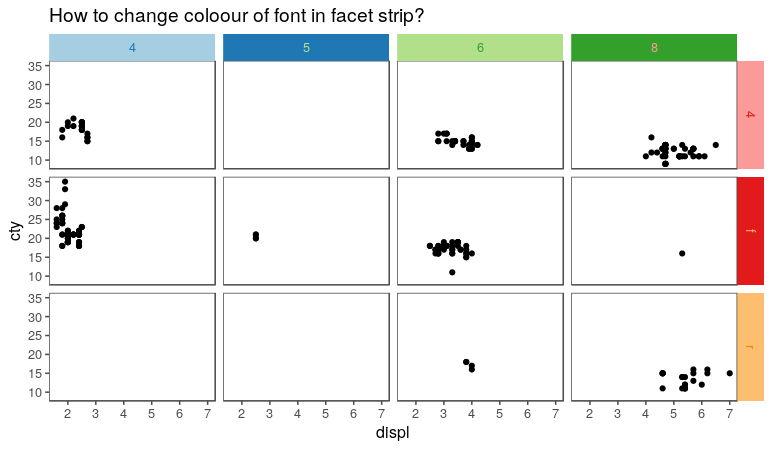
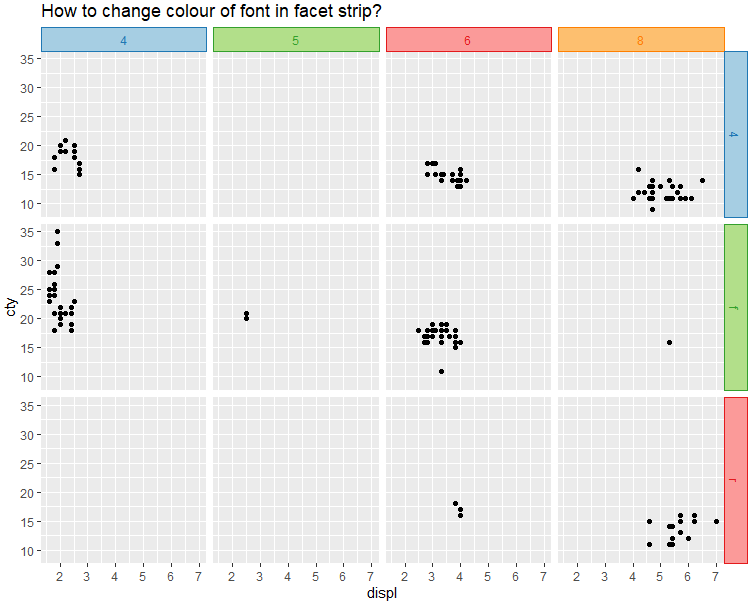
Although the question was already answered long ago I've wrapped a function to easily set background, border and text colour of individual facets based on previous answers. I'm posting it in case it is of help to someone else.
library(dplyr)
library(ggplot2)
library(RColorBrewer)
The function:
modify_facet_appearance <- function(plot = NULL,
                                    strip.background.x.fill = NULL,
                                    strip.background.y.fill = NULL,
                                    strip.background.x.col = NULL,
                                    strip.background.y.col = NULL,
                                    strip.text.x.col = NULL,
                                    strip.text.y.col = NULL){

  if(is.null(plot)){stop("A ggplot (gg class) needs to be provided!")}

  # Generate gtable object to modify the facet strips:
  g <- ggplot_gtable(ggplot_build(plot))

  # Get the locations of the right and top facets in g:
  stripy <- which(grepl('strip-r|strip-l', g$layout$name)) # account for when strip positions are switched r-l and/or t-b in facet_grid(switch = )
  stripx <- which(grepl('strip-t|strip-b', g$layout$name))

  # Check that the provided value arrays have the same length as strips the plot has:
  lx <- c(length(strip.background.x.fill), length(strip.background.x.col), length(strip.text.x.col))
  if(!all(lx==length(stripx) | lx==0)){stop("The provided vectors with values need to have the same length and the number of facets in the plot!")}
  ly <- c(length(strip.background.y.fill), length(strip.background.y.col), length(strip.text.y.col))
  if(!all(ly==length(stripy) | ly==0)){stop("The provided vectors with values need to have the same length and the number of facets in the plot!")}

  # Change the strips on the y axis:
  for (i in seq_along(stripy)){ # if no strips in the right, the loop will not be executed as seq_along(stripy) will be integer(0)

    # Change strip fill and (border) colour :
    j1 <- which(grepl('strip.background.y', g$grobs[[stripy[i]]]$grobs[[1]]$childrenOrder))
    if(!is.null(strip.background.y.fill[i])){g$grobs[[stripy[i]]]$grobs[[1]]$children[[j1]]$gp$fill <- strip.background.y.fill[i]} # fill
    if(!is.null(strip.background.y.col[i])){g$grobs[[stripy[i]]]$grobs[[1]]$children[[j1]]$gp$col <- strip.background.y.col[i]} # border colour

    # Change color of text:
    j2 <- which(grepl('strip.text.y', g$grobs[[stripy[i]]]$grobs[[1]]$childrenOrder))
    if(!is.null(strip.text.y.col[i])){g$grobs[[stripy[i]]]$grobs[[1]]$children[[j2]]$children[[1]]$gp$col <- strip.text.y.col[i]}

  }

  # Same but for the x axis:
  for (i in seq_along(stripx)){

    # Change strip fill and (border) colour :
    j1 <- which(grepl('strip.background.x', g$grobs[[stripx[i]]]$grobs[[1]]$childrenOrder))
    if(!is.null(strip.background.x.fill[i])){g$grobs[[stripx[i]]]$grobs[[1]]$children[[j1]]$gp$fill <- strip.background.x.fill[i]} # fill
    if(!is.null(strip.background.x.col[i])){g$grobs[[stripx[i]]]$grobs[[1]]$children[[j1]]$gp$col <- strip.background.x.col[i]} # border colour

    # Change color of text:
    j2 <- which(grepl('strip.text.x', g$grobs[[stripx[i]]]$grobs[[1]]$childrenOrder))
    if(!is.null(strip.text.x.col[i])){g$grobs[[stripx[i]]]$grobs[[1]]$children[[j2]]$children[[1]]$gp$col <- strip.text.x.col[i]}

  }

  return(g)

  # Note that it returns a gtable object. This can be ploted with plot() or grid::draw.grid().
  # patchwork can handle the addition of such gtable to a layout with other ggplot objects,
  # but be sure to use patchwork::wrap_ggplot_grob(g) for proper alignment of plots!
  # See: https://patchwork.data-imaginist.com/reference/wrap_ggplot_grob.html

}
Example:
The function can be piped from a gg object sort of in the same spirit as adding + theme().
pal.y <- brewer.pal(length(unique(mpg$drv))*2, "Paired")
pal.x <- brewer.pal(length(unique(mpg$cyl))*2, "Paired")

p <- {ggplot(mpg, aes(displ, cty)) +
  geom_point() +
  facet_grid(drv ~ cyl) +
  ggtitle("How to change colour of font in facet strip?")} %>%
  modify_facet_appearance(strip.background.x.fill = pal.x[seq(1, length(pal.x), 2)],
                          strip.background.x.col = pal.x[seq(2, length(pal.x), 2)],
                          strip.text.x.col = pal.x[seq(2, length(pal.x), 2)],
                          strip.background.y.fill = pal.y[seq(1, length(pal.y), 2)],
                          strip.background.y.col = pal.y[seq(2, length(pal.y), 2)],
                          strip.text.y.col = pal.y[seq(2, length(pal.y), 2)])
plot(p)
![enter image description here]()


