I am having some trouble with the ccf() method in the (Python) statsmodels library. The equivalent operation works fine in R.
ccf produces a cross-correlation function between two variables, A and B in my example. I am interested to understand the extent to which A is a leading indicator for B.
I am using the following:
import pandas as pd
import numpy as np
import statsmodels.tsa.stattools as smt
I can simulate A and B as follows:
np.random.seed(123)
test = pd.DataFrame(np.random.randint(0,25,size=(79, 2)), columns=list('AB'))
When I run ccf, I get the following:
ccf_output = smt.ccf(test['A'],test['B'], unbiased=False)
ccf_output
array([ 0.09447372, -0.12810284,  0.15581492, -0.05123683,  0.23403344,
    0.0771812 ,  0.01434263,  0.00986775, -0.23812752, -0.03996113,
   -0.14383829,  0.0178347 ,  0.23224969,  0.0829421 ,  0.14981321,
   -0.07094772, -0.17713121,  0.15377192, -0.19161986,  0.08006699,
   -0.01044449, -0.04913098,  0.06682942, -0.02087582,  0.06453489,
    0.01995989, -0.08961562,  0.02076603,  0.01085041, -0.01357792,
    0.17009109, -0.07586774, -0.0183845 , -0.0327533 , -0.19266634,
   -0.00433252, -0.00915397,  0.11568826, -0.02069836, -0.03110162,
    0.08500599,  0.01171839, -0.04837527,  0.10352341, -0.14512205,
   -0.00203772,  0.13876788, -0.20846099,  0.30174408, -0.05674962,
   -0.03824093,  0.04494932, -0.21788683,  0.00113469,  0.07381456,
   -0.04039815,  0.06661601, -0.04302084,  0.01624429, -0.00399155,
   -0.0359768 ,  0.10264208, -0.09216649,  0.06391548,  0.04904064,
   -0.05930197,  0.11127125, -0.06346119, -0.08973581,  0.06459495,
   -0.09600202,  0.02720553,  0.05152299, -0.0220437 ,  0.04818264,
   -0.02235086, -0.05485135, -0.01077366,  0.02566737])
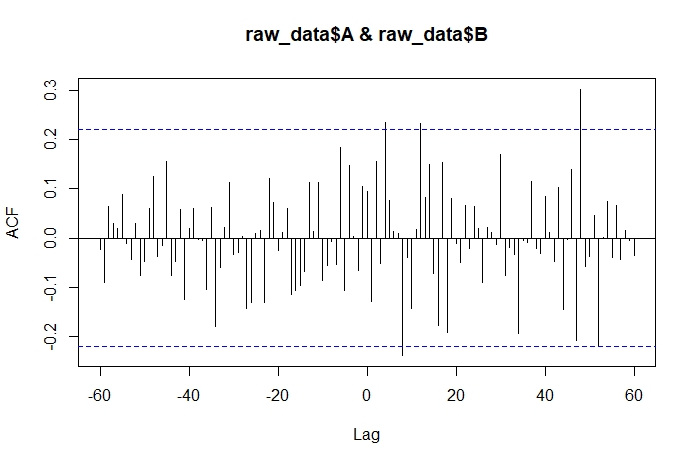
Here is the outcome I am trying to get to (produced in R):
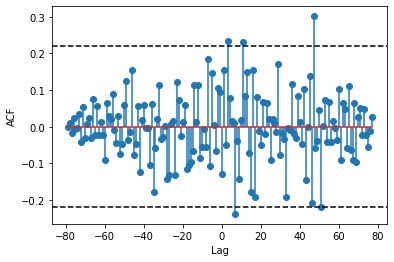
The problem is this: ccf_output is giving me only the correlation values for lag 0 and to the right of Lag 0. Ideally, I would like the full set of lag values (lag -60 to lag 60) so that I can produce something like the above plot.
Is there a way to do this?


