plotly px.scatter_3d marker size
Asked Answered
M

1

8

I have a dataframe df:

              x         y         z  ... colours marker_size  marker_opacity
test1  0.118709  0.219099 -0.024387  ...     red         100             0.5
test2 -0.344873 -0.401508  0.169995  ...    blue         100             0.5
test3 -0.226923  0.021078  0.400358  ...     red         100             0.5
test4  0.085421  0.098442 -0.588749  ...  purple         100             0.5
test5  0.367666  0.062889  0.042783  ...   green         100             0.5

I am trying to plot this with plotly like so:

fig = px.scatter_3d(df, 
                    x='x', y='y', z = 'z', 
                    color='labels', 
                    hover_name = df.index, 
                    opacity = 0.5, 
                    size = 'marker_size')   
fig.write_html(file_name)

When I open file_name, everything is fine, but my points are too big. When I alter the 'marker_size' column of my df, nothing changes (I have tried 0.1, 1, 10, 100...).

Why is this?

I have also tried:

Param:

size = 1:

Result:

ValueError: Value of 'size' is not the name of a column in 'data_frame'. Expected one of ['x', 'y', 'z', 'labels', 'colours', 'marker_size', 'marker_opacity'] but received: 1

Param:

size = [1]*len(df):

Result: No difference to using the 'marker_size' df column

Metalware answered 11/11, 2021 at 12:18 Comment(0)
R
16

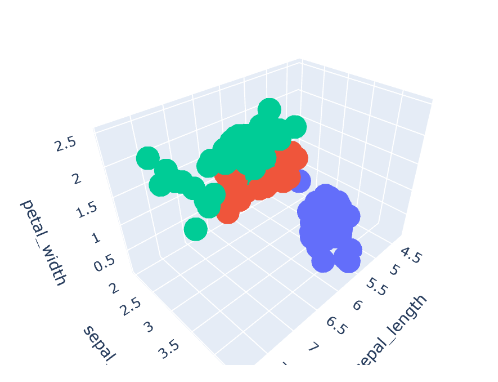
If you're looking to increase the marker size of all traces, just use:

fig.update_traces(marker_size = 12)

enter image description here

Details:

The size attribute of px.scatter_3d isn't there to let you specify the size of your markers directly. But rather to let you add a fourth dimension to your scatter plot representing the varying size of another variable.

size: str or int or Series or array-like
    Either a name of a column in `data_frame`, or a pandas Series or
    array_like object. Values from this column or array_like are used to
    assign mark sizes.

The reason why changing the value from 1 to 10 or 100 is that you seem to have been changing all the values in df['marker_size'] at the same time:

enter image description here

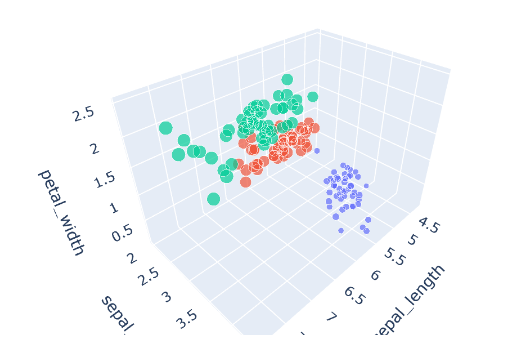
In order for such an assignment to have effect, you would need to have a variable and not a constant in df['marker_size']. You can take a closer look at how these things work through this snippet:

import plotly.express as px
df = px.data.iris()

fig = px.scatter_3d(df, x='sepal_length', y='sepal_width', z='petal_width',
              color='species',
              size = 'petal_length'
                   )

fig.show()

enter image description here

Here you can see that the size attribute works as intended, since your markers will have varying sizes as defined by df['petal_length]:

enter image description here

Reflective answered 11/11, 2021 at 12:34 Comment(2)
Ah perfect, thanks very much!Metalware
Can't possibly tell u how much that line helped me!Tenebrific

© 2022 - 2024 — McMap. All rights reserved.