Drawing shapes in Android MapView independent of the zoom level
Asked Answered
N

4

8

I need to draw shapes just like those you would create with custom maps on Google Maps, using Android's MapView.

In other words, if I draw a shape on the map, when I zoom out it should shrink, covering the same area of the map regardless of the zoom level.

Example following the Android Reference:

  @Override
  public boolean draw(Canvas canvas, MapView mapView, boolean shadow, long when)
  {
      super.draw(canvas, mapView, shadow);

      //---translate the GeoPoint to screen pixels---
      Point screenPts = new Point();
      mapView.getProjection().toPixels(p, screenPts);

      Paint boxPaint = new Paint();
      boxPaint.setColor(android.graphics.Color.WHITE);
      boxPaint.setStyle(Paint.Style.FILL);
      boxPaint.setAlpha(140);
      canvas.drawCircle(screenPts.x, screenPts.y, 20, boxPaint);

      return true;
  }

This shows a white circle on the map, but if you zoom out, the circle is the same size. Perhaps using canvas is not right approach?

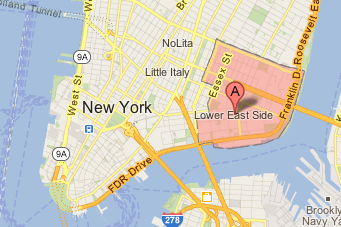
I need something like how Google Maps highlights neighborhoods or cities:

Google Map showing the search result for Lower East Side, New York

Any ideas? Thanks in advance!

Nemeth answered 29/5, 2012 at 2:10 Comment(1)
Start with Overlay help to draw shape Here you goStyrene
U
8

I had the same problem myself, here's a full solution with demo locations:

import java.util.*;

import android.graphics.*;
import android.graphics.Paint.Style;
import android.graphics.Region.Op;
import android.os.Bundle;

import com.google.android.maps.*;

public class ShapeOverlayTest extends MapActivity {
    private MapView m_map;

    @Override
    public void onCreate(final Bundle savedInstanceState) {
        super.onCreate(savedInstanceState);
        setContentView(R.layout.activity_main);

        m_map = (MapView) findViewById(R.id.mapview);
        m_map.displayZoomControls(true);
        m_map.setBuiltInZoomControls(true);
    }

    @Override
    protected void onStart() {
        super.onStart();

        Loc[][] areas = {
            {
            new Loc(51.51695436113811, -0.28686325139653757),
            new Loc(51.5268179962453, -0.28118722558738923),
            new Loc(51.526498459594215, -0.27779666308279755),
            new Loc(51.52521530775356, -0.26943974607777654),
            new Loc(51.52292555645698, -0.25813738590178786),
            new Loc(51.52054465991048, -0.2498381618983569),
            new Loc(51.51012230470141, -0.24509233633017083),
            new Loc(51.50884762913046, -0.24465130560570497),
            new Loc(51.50732063336974, -0.2441767643132881),
            new Loc(51.50431624597833, -0.24473900326760137),
            new Loc(51.49756328092904, -0.2714528238165076),
            new Loc(51.50092541797557, -0.28360267232347336),
            new Loc(51.50205958485736, -0.28490018935582045),
            new Loc(51.50488447379555, -0.28681164237730944)
            },
            {
            new Loc(51.50368617913765, -0.25313579464343156),
            new Loc(51.51978611305675, -0.24842567405905958),
            new Loc(51.51039382684418, -0.24460628015366626),
            new Loc(51.508792552597576, -0.24397604687682156),
            new Loc(51.50713008309719, -0.24346350415674722),
            new Loc(51.502411013302684, -0.2508501075008919),
            new Loc(51.502377240039664, -0.25160073203846817),
            new Loc(51.50274364303565, -0.25204783703705536)
            },
            {
            new Loc(51.49924084955314, -0.2858705706471945),
            new Loc(51.50212820259818, -0.2791479893522646),
            new Loc(51.49724510427319, -0.27427453152961206),
            new Loc(51.49429724502515, -0.2799184038304611),
            new Loc(51.494270969987404, -0.28180678948730314)
            }
        };
        String[] areaNames = { "W3 Ealing", "W3 Hammersmith & Fulham", "W3 Hounslow" };

        // for (Map.Entry<String, List<Loc>> area : m_areas.entrySet()) {
        // // to have much less points and make sure they are in order
        // // the demo data already has these properties
        // // http://en.wikipedia.org/wiki/Gift_wrapping_algorithm#Pseudocode
        // area.setValue(Algo.convexHull(area.getValue()));
        // }

        Map<String, List<GeoPoint>> areaMap = new HashMap<String, List<GeoPoint>>();
        for (int i = 0; i < areaNames.length; i++) {
            List<GeoPoint> points = new ArrayList<GeoPoint>();
            for (int j = 0; j < areas[i].length; j++) {
                points.add(areas[i][j].toGeoPoint());
            }
            areaMap.put(areaNames[i], points);
        }
        m_map.getOverlays().add(new AreasOverlay(areaMap));

        // TODO determine location better, e.g. averaging area points
        GeoPoint center = new GeoPoint(51509704, -270710);
        m_map.getController().setCenter(center);
        m_map.getController().setZoom(15);
    }

    @Override
    protected boolean isRouteDisplayed() {
        return false;
    }

    static class Loc {
        private double  m_lat;
        private double  m_lon;

        public Loc(final double lat, final double lon) {
            m_lat = lat;
            m_lon = lon;
        }

        public GeoPoint toGeoPoint() {
            return new GeoPoint((int) (m_lat * 1e6), (int) (m_lon * 1e6));
        }
    };

    static class AreasOverlay extends Overlay {
        private final Map<String, List<GeoPoint>> m_areas;
        private final Paint m_paintFill;
        private final Paint m_paintStroke;
        private static final int ALPHA = 0x30ffffff; // 48 out of 255 transparent
        private static final int[] COLORS =
        { Color.YELLOW, Color.MAGENTA, Color.CYAN, Color.RED, Color.GREEN, Color.BLUE };
        static {
            for (int i = 0; i < AreasOverlay.COLORS.length; i++) {
                AreasOverlay.COLORS[i] &= AreasOverlay.ALPHA;
            }
        }

        public AreasOverlay(final Map<String, List<GeoPoint>> areaMap) {
            m_areas = areaMap;

            // prepare paints
            m_paintFill = new Paint();
            m_paintFill.setStyle(Paint.Style.FILL);
            m_paintStroke = new Paint(Paint.ANTI_ALIAS_FLAG);
            m_paintStroke.setStyle(Style.STROKE);
            m_paintStroke.setAntiAlias(true);
            m_paintStroke.setStrokeWidth(3);
        }

        @Override
        public void draw(final Canvas canvas, final MapView mapView, final boolean shadow) {
            super.draw(canvas, mapView, shadow);
            if (shadow) {
                return;
            }
            Projection projection = mapView.getProjection();

            List<Path> areaPaths = getPaths(projection, m_areas);
            drawPaths(canvas, areaPaths);
        }

        private List<Path> getPaths(final Projection projection, final Map<String, List<GeoPoint>> areas) {
            List<Path> areaPaths = new ArrayList<Path>(areas.size());
            for (Map.Entry<String, List<GeoPoint>> entry : areas.entrySet()) {
                List<GeoPoint> sourceList = entry.getValue();
                Path path = new Path();
                path.setFillType(Path.FillType.EVEN_ODD);
                Iterator<GeoPoint> it = sourceList.iterator();
                Point point = nextDrawPoint(projection, it);
                path.moveTo(point.x, point.y);
                while (it.hasNext()) {
                    point = nextDrawPoint(projection, it);
                    path.lineTo(point.x, point.y);
                }
                path.close();
                areaPaths.add(path);
            }
            return areaPaths;
        }

        /**
         * <ul>
         * <li>Draw with different colors.
         * <li>Draw strokes first for them to be always visible.
         * <li>Draw fills next with each removing from the drawable area.
         * </ul>
         */
        private void drawPaths(final Canvas canvas, final List<Path> areaPaths) {
            int currentColorIndex;

            currentColorIndex = 0;
            for (Path path : areaPaths) {
                int currentColor = AreasOverlay.COLORS[currentColorIndex++];
                currentColorIndex %= AreasOverlay.COLORS.length;
                m_paintStroke.setColor(currentColor & 0xff7f7f7f); // make it darker by clearing the high bit
                canvas.drawPath(path, m_paintStroke);
            }
            currentColorIndex = 0;
            for (Path path : areaPaths) {
                int currentColor = AreasOverlay.COLORS[currentColorIndex++];
                currentColorIndex %= AreasOverlay.COLORS.length;
                m_paintFill.setColor(currentColor);
                canvas.drawPath(path, m_paintFill);
                canvas.clipPath(path, Op.DIFFERENCE); // don't allow to draw over each other
            }
        }

        private Point nextDrawPoint(final Projection projection, final Iterator<GeoPoint> it) {
            GeoPoint geo = it.next();
            Point p = new Point();
            projection.toPixels(geo, p);
            return p;
        }
    }
}
Urbano answered 25/7, 2012 at 23:41 Comment(0)
B
5

The radius for drawCircle is in pixels so it make sense that the circle is always the same size. You have to scale the radius based on the zoom level. The example below will graph a geometry from the JTS Topology Suite that will scale.

public class MapOverlay extends Overlay {
    private static final String TAG = MapOverlay.class.getName();

    // Allocate once and reuse
    private final Paint mPaint = new Paint();
    private final Path mPath = new Path();

    // Region to highlight
    private Geometry mGeometry;

    /**
     * @param  geometry Region to highlight on map
     */
    public MapOverlay(Geometry geometry) {
            // Set region
            mGeometry = geometry;

            // Edit paint style
            mPaint.setDither(true);
            mPaint.setColor(Color.rgb(128, 136, 231));
            mPaint.setAlpha(100);
            mPaint.setStyle(Paint.Style.FILL_AND_STROKE);
            mPaint.setStrokeJoin(Paint.Join.ROUND);
            mPaint.setStrokeCap(Paint.Cap.ROUND);
            mPaint.setStrokeWidth(6);
    }


    /**
     * Draw the overlay over the map.
     * 
     * @see com.google.android.maps.Overlay#draw(Canvas, MapView, boolean)
     */
    @Override
    public void draw(Canvas canvas, MapView mapv, boolean shadow) {
            super.draw(canvas, mapv, shadow);

            if (mGeometry != null) {
                    // TODO There could be more than one geometries  
                    Geometry g = mGeometry.getGeometryN(0);
                    final Point p = new Point();
                    boolean first = true;

                    mPath.reset();
                    for (Coordinate c : g.getCoordinates()) {
                            // Convert lat/lon to pixels on screen
                            // GeoPoint is immutable so allocation is unavoidable
                            Projection projection = mapv.getProjection();
                            projection.toPixels(new GeoPoint((int) (c.y * 1E6), (int) (c.x * 1E6)), p);

                            // Set path starting point to first coordinate
                            // otherwise default start is (0,0)
                            if (first) {
                                    mPath.moveTo(p.x, p.y);
                                    first = false;
                            }

                            // Add new point to path
                            mPath.lineTo(p.x, p.y);
                    }
            }

            // Draw the path with give paint
            canvas.drawPath(mPath, mPaint);
    }

Adapted from here: MapSelectionOverlay.java

Borchers answered 30/7, 2012 at 13:17 Comment(1)
Where'd you get the Geometry classes?Dissolvent
M
2

This maybe what you are looking for: Can "overlay" size be zoomed together with the google map on android?

public class ImpactOverlay extends Overlay {

private static int CIRCLERADIUS = 0;
private GeoPoint geopoint;

public ImpactOverlay(GeoPoint point, int myRadius) {
    geopoint = point;
    CIRCLERADIUS = myRadius;
}

@Override
public void draw(Canvas canvas, MapView mapView, boolean shadow) {
    // Transfrom geoposition to Point on canvas
    Projection projection = mapView.getProjection();
    Point point = new Point();
    projection.toPixels(geopoint, point);

    // the circle to mark the spot
    Paint circle = new Paint();
    circle.setColor(Color.BLACK);
    int myCircleRadius = metersToRadius(CIRCLERADIUS, mapView, (double)geopoint.getLatitudeE6()/1000000);
    canvas.drawCircle(point.x, point.y, myCircleRadius, circle);
}

public static int metersToRadius(float meters, MapView map, double latitude) {
    return (int) (map.getProjection().metersToEquatorPixels(meters) * (1/ Math.cos(Math.toRadians(latitude))));         
}
}
Mesquite answered 24/7, 2012 at 7:24 Comment(3)
this solves circle, what about polygon as shown above i.sstatic.net/5goEw.pngThrasher
I'd say that Google would draw multiple rectangles repeatedly in the covered area. They will then draw dash-line on the outer edge of the union area. Graphics plotting and scaling is done via traditional method. However, this is only my speculation. I'm sure the whole thing is much more complicated than that. Google has all location details regarding that address such as postcode or city, etc. So it's probably easier for them to group those info into one object then use those info for precisely plotting the area. Again, I'm just guessing how this should work.Mesquite
I find that drawing these circles on the map view can really slow down map scrolling as you zoom closer in on the shape, and then once it gets to a certain zoom, the circle will disappear. how is this generally handled if you don't want the circle to disappear from the map?Dissolvent
P
2

What you need is a list of lat/lon points for each shape you want to draw on the map. In the onDraw method, you need to iterate over that list (for each shape you want to draw), and do this:

//---translate the GeoPoint to screen pixels---
  Point screenPts = new Point();
  mapView.getProjection().toPixels(p, screenPts);

then draw the shape on the canvas. IIRC that works correctly regardless of zoom, because the mapView is aware of the zoom level, and gives you the appropriate pixel location for the lat/long pair at that zoom level.

Persiflage answered 24/7, 2012 at 12:43 Comment(3)
Indeed, as far as I know, projecting to pixels causes drawings to appear independent of zoom levels.Bury
Well, you won't have to manage the zoom level, the projection math knows how to handle the zoom level.Persiflage
@tolgap, your assertion about toPixels() is incorrect. It's who purpose is to deal with zoom levels! @Persiflage is describing a correct answer. You will need a description of the polygon you want to render. If that description is a list of vertices in lat/lon coordinate space, then you only need to convert these to pixels and draw. The projection do the rest of the work.Peachey

© 2022 - 2024 — McMap. All rights reserved.