How to use two datasets in chart.js doughnut chart?
Asked Answered
O

2

8

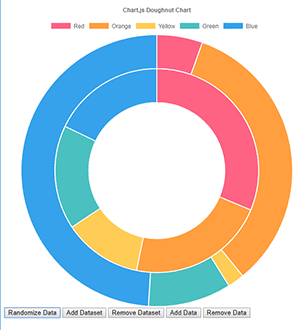
On the chart.js website, if you click the "Add Dataset" button under the chart, you get a doughnut inside a doughnut. Here's a screenshot of what it looks like:

enter image description here

This is what I want, but I can't figure out how to add the second dataset in even when I view the source code...So I guessed (line 8 below). My guess is wrong, if delete line 8, I get a doughnut with a single ring.

Here's a snippet of the code I tried:

<canvas id="OR-County-chart" style="min-height:20em;"></canvas>
       <script>
            var ctxb = $('#OR-County-chart');
            var data = {
                labels: ["Baker County","Benton County","Clackamas County", "Clatsop County", "Columbia County", "Coos County", "Crook County", "Curry County", "Deschutes County", "Douglas County", "Gilliam County", "Grant County", "Harney County", "Hood River County", "Jackson County", "Jefferson County", "Josephine County", "Klamath County", "Lake County", "Lane County", "Lincoln County", "Linn County", "Malheur County", "Marion County", "Morrow County", "Multnomah County", "Polk County", "Sherman County", "Tillamook County", "Umatilla County", "Union County", "Wallowa County", "Wasco County", "Washington County", "Wheeler County", "Yamhill County"],
                datasets: [{
                    data: [{tag_baker county spend},{tag_benton county spend},{tag_clackamas county spend},{tag_clatsop county spend},{tag_columbia county spend}, {tag_coos county spend}, {tag_crook county spend}, {tag_curry county spend}, {tag_deschutes county spend}, {tag_douglas county spend}, {tag_gilliam county spend}, {tag_grant county spend}, {tag_harney county spend}, {tag_hood river county spend}, {tag_jackson county spend}, {tag_jefferson county spend}, {tag_josephine county spend}, {tag_klamath county spend}, {tag_lake county spend}, {tag_lane county spend}, {tag_lincoln county spend}, {tag_linn county spend}, {tag_malheur county spend}, {tag_marion county spend}, {tag_morrow county spend}, {tag_multnomah county spend}, {tag_polk county spend}, {tag_sherman county spend}, {tag_tillamook county spend}, {tag_umatilla county spend}, {tag_union county spend}, {tag_wallowa county spend}, {tag_wasco county spend}, {tag_washington county spend}, {tag_wheeler county spend}, {tag_yamhill county spend}],
                    [{tag_baker county funded properties},{tag_benton county funded properties},{tag_clackamas county funded properties},{tag_clatsop couty funded properties},{tag_columbia county funded properties},{tag_coos county funded properties},{tag_crook county funded properties},{tag_curry county funded properties},{tag_deschutes county funded properties},{tag_douglas county funded properties},{tag_gilliam county funded properties},{tag_grant county funded properties},{tag_harney county funded properties},{tag_hood river county funded properties},{tag_jackson county funded properties},{tag_jefferson county funded properties},{tag_josephine county funded properties},{tag_klamath county funded properties},{tag_lake county funded properties},{tag_lane county funded properties},{tag_lincoln county funded properties},{tag_linn county funded properties},{tag_malheur county funded properties},{tag_marion county funded properties},{tag_morrow county funded properties},{tag_multnomah county funded properties},{tag_polk county funded properties},{tag_sherman county funded properties},{tag_tillamook county funded properties},{tag_umatilla county funded properties},{tag_union county funded properties},{tag_wallowa county funded properties},{tag_wasco county funded properties},{tag_washington county funded properties},{tag_wheeler county funded properties},{tag_yamhill county funded properties}]
                    backgroundColor: [
                        'rgba(33,43,64,1)',//baker
                        'rgba(194,244,120,1)',//benton
                        'rgba(223,211,182,1)',//clackamas
                        'rgba(186,220,221,1)',//clatsop

I searched for a jsfiddle for an example, but couldn't find one.

Overthecounter answered 19/7, 2017 at 6:36 Comment(0)
G
16

Just went through the code on their sample. It appears that an object in the data set array should have the following structure

{
            data: [
                <a number>,
                <a number>,
                ...
            ],
            backgroundColor: [
                <a colour>,
                <a colour>,
                ...
            ],
            label: 'Unique label for this data set
}

I have created the below snippet for you.

var config = {
  type: 'doughnut',
  data: {
    datasets: [
     /* Outer doughnut data starts*/
    {
      data: [
        10,
        20,
        30
      ],
      backgroundColor: [
        "rgb(255, 0, 0)", // red
        "rgb(0, 255, 0)", // green
        "rgb(0, 0, 255)", //blue
      ],
      label: 'Doughnut 1'
    },
    /* Outer doughnut data ends*/
    /* Inner doughnut data starts*/
    {
      data: [
        45,
        25,
        11
      ],
      backgroundColor: [
        "rgb(255, 0, 0)", // red
        "rgb(0, 255, 0)", // green
        "rgb(0, 0, 255)", //blue
      ],
      label: 'Doughnut 2'
    }
    /* Inner doughnut data ends*/
    ],
    labels: [
      "Info 1",
      "Info 2",
      "Info 3"
    ]
  },
  options: {
    responsive: true,
    legend: {
      position: 'top',
    },
    title: {
      display: true,
      text: 'Chart.js Doughnut Chart'
    },
    animation: {
      animateScale: true,
      animateRotate: true
    },
    tooltips: {
      callbacks: {
        label: function(item, data) {
        console.log(data.labels, item);
            return data.datasets[item.datasetIndex].label+ ": "+ data.labels[item.index]+ ": "+ data.datasets[item.datasetIndex].data[item.index];
        }
    }
}
  }
};
window.onload = function() {
  var ctx = document.getElementById("myChart")
    .getContext("2d");
  window.myDoughnut = new Chart(ctx, config);
};
<html>

<head>
  <script src="https://cdnjs.cloudflare.com/ajax/libs/Chart.js/2.6.0/Chart.bundle.js"></script>
</head>

<body>
  <canvas id="myChart"></canvas>
</body>

</html>
Guesstimate answered 19/7, 2017 at 7:54 Comment(6)
As you can see, I just added another object describing the data in my config.data.datasets array, and it became the inner doughnutGuesstimate
If you need another doughnut, you can push a new object of the described format to config.data.datasets and then call window.myDoughnut.update();Guesstimate
This works perfectly and it's a perfect format for the data I am trying to visualize. This is a dev site, but you can see it at the bottom here: hhf-reporting.worldsecuresystems.comOverthecounter
How do you distinguish the datasets though? Both red sections are labelled Info 1, and there's nothing to say "Doughnut 1".Andrey
@SharpC, yeah, this is happening despite mentioning the "label" parameter. This issue is there in their example as well. Could you raise a bug report?Guesstimate
I found a solution - see the Erdou comment here: github.com/chartjs/Chart.js/issues/1417.Andrey
P
1

If you use Chart.js version 3.x or higher.

In the 'data' field, we add more charts by adding elements for the 'datasets' array.

data: {
  labels: [], // Label of Legends and Slices on Doughnut Chart.
  datasets: [
    {
      data: [], // Doughnut Chart data.
      backgroundColor: [], // Color of Slices on Doughnut Chart.
      ...
    }
  ]
};

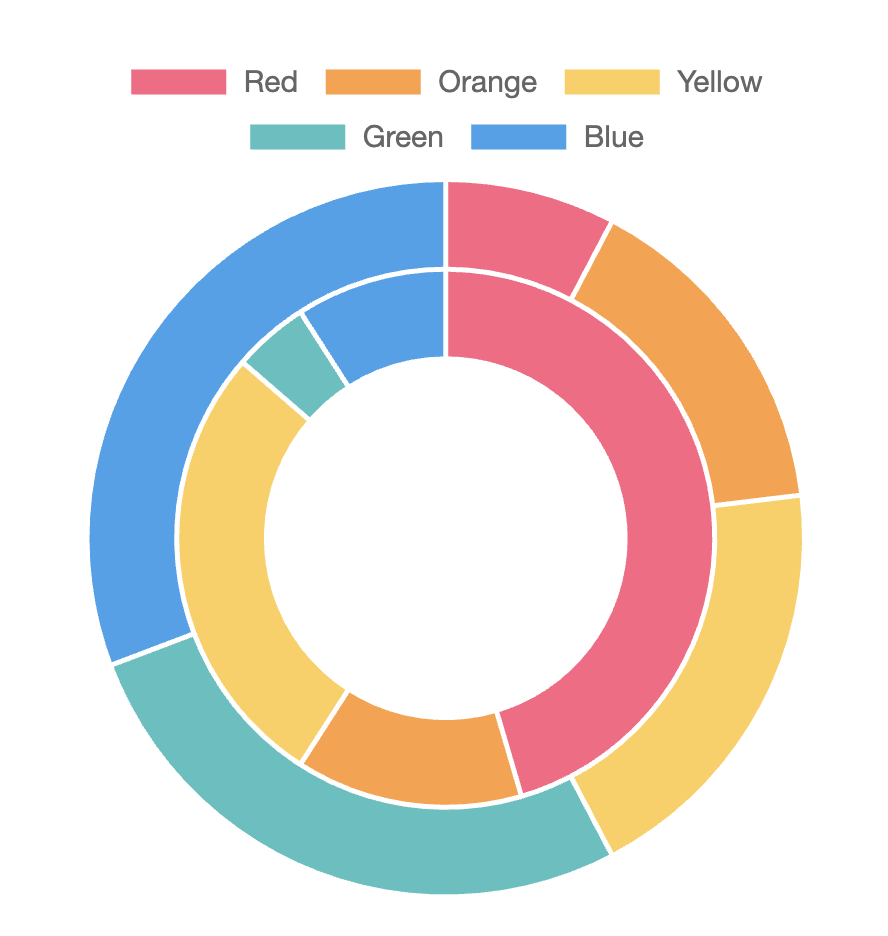
Simple example: enter image description here

var ctx = document.getElementById('myChart');
var data = {
  labels: ['Red', 'Orange', 'Yellow', 'Green', 'Blue'],
  datasets: [
    {
      data: [20, 40, 50, 70, 80],
      backgroundColor: ['#ff6384', '#ff9f40', '#ffcd56', '#4bc0c0', '#36a2eb'],
    },
    {
      data: [100, 30, 60, 10, 20],
      backgroundColor: ['#ff6384', '#ff9f40', '#ffcd56', '#4bc0c0', '#36a2eb'],
    },
  ],
};

var options = {
  responsive: true,
  plugins: {
    legend: {
      onClick: this.handleClick,
      onHover: this.handleHover,
      onLeave: this.handleLeave,
    },
  },
};

var myDoughnutChart = new Chart(ctx, {
  type: 'doughnut',
  data,
  options,
});
<script src="https://cdnjs.cloudflare.com/ajax/libs/Chart.js/3.0.0-beta.6/chart.js"></script>
<canvas id="myChart" width="400" height="400"></canvas>

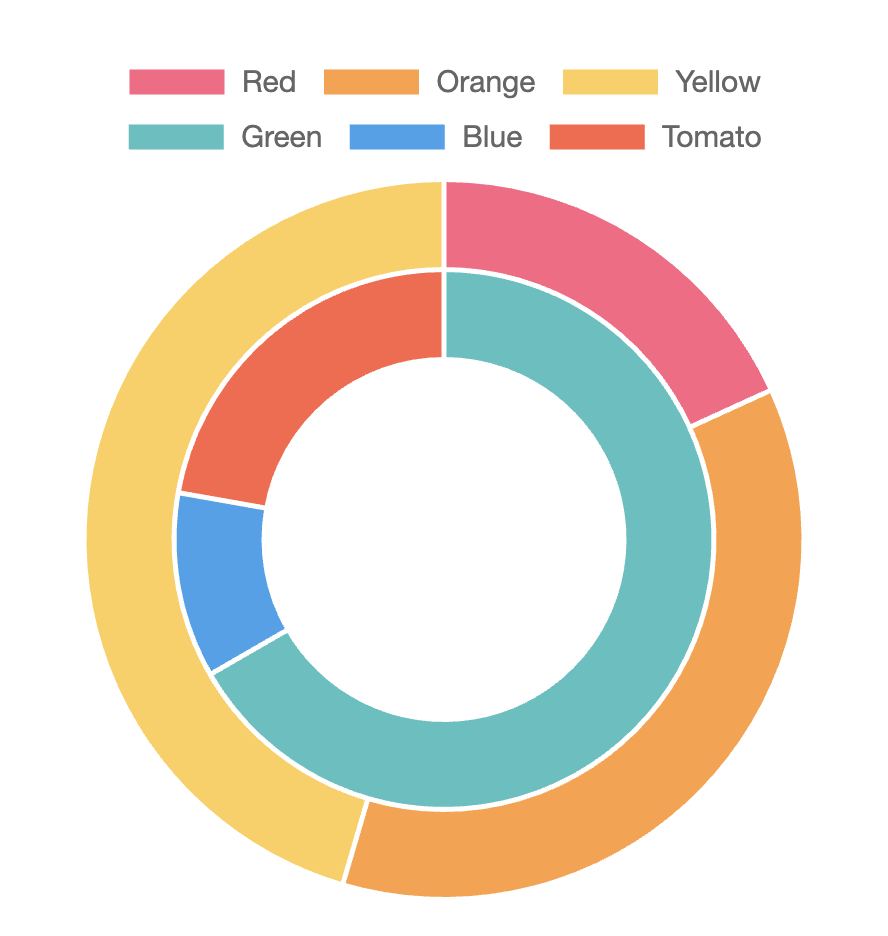
Example: Legends for Two Chart Different Colors enter image description here

var ctx = document.getElementById('myChart');
var data = {
  labels: ['Red', 'Orange', 'Yellow', 'Green', 'Blue', 'Tomato'],
  datasets: [
    {
      data: [20, 40, 50, null, null, null],
      backgroundColor: ['#ff6384', '#ff9f40', '#ffcd56', '#4bc0c0', '#36a2eb', 'tomato'],
    },
    {
      data: [null, null, null, 60, 10, 20],
      backgroundColor: [null, null, null, '#4bc0c0', '#36a2eb', 'tomato'],
    },
  ],
};

var options = {
  responsive: true,
  plugins: {
    legend: {
      onClick: this.handleClick,
      onHover: this.handleHover,
      onLeave: this.handleLeave,
    },
  },
};

var myDoughnutChart = new Chart(ctx, {
  type: 'doughnut',
  data,
  options,
});
<script src="https://cdnjs.cloudflare.com/ajax/libs/Chart.js/3.0.0-beta.6/chart.js"></script>
<canvas id="myChart" width="400" height="400"></canvas>

Example: Legends for Multiple Chart Different Colors enter image description here

Plagioclase answered 26/8, 2023 at 20:28 Comment(0)

© 2022 - 2024 — McMap. All rights reserved.