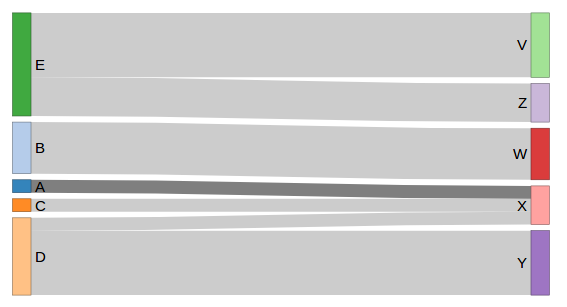
I have a simple sankey diagram, generated using networkD3 package inside a shiny app. How can source and/or target nodes be sorted?
As you can see in the MWE, by default, neither source nodes (A, B, C, D, E) nor target nodes (V, W, X, Y, Z) are sorted. At least, sorting is not comprehensible to me.
Code:
library("shiny")
library("networkD3")

ui <- fluidPage(
  column(3),
  column(6, sankeyNetworkOutput("mySankeyD")),
  column(3)
)

server <- function(input, output) {
  output$mySankeyD <- renderSankeyNetwork({
    myDf <- list(
      nodes=data.frame(name=c( "A", "B", "C", "D", "E",
                               "V", "W", "X", "Y", "Z")),
      links=data.frame(source=as.integer(c(0, 1, 2, 3, 3, 4, 4)),
                       target=as.integer(c(7, 6, 7, 8, 7, 5, 9)),
                       value =           c(1, 4, 1, 5, 1, 5, 3)
      )
    )

    sankeyNetwork(Links = myDf$links, Nodes = myDf$nodes, Source = "source",
                  Target = "target", Value = "value", NodeID = "name",
                  units = "TWh", fontSize = 25, nodeWidth = 30, fontFamily = "sans-serif", iterations = 30)
  })
}

shinyApp(ui, server)
How does sankeyNetwork() determine the order of nodes? Is it possible to sort them alphabetically?
I'd like to have sorted source nodes, if possible also sorted target nodes.
EDIT As @emilliman5 pointed out in the comment, it is no possible to sort the nodes manually.
Thus, are there other R packages out there to generate sankey diagrams that allow sorting of nodes? If yes, how to do so?


riverplotpackage lets you do this but the plot is not interactive.rChartsmaybe able to do it as well with a little elbow grease. – Pion