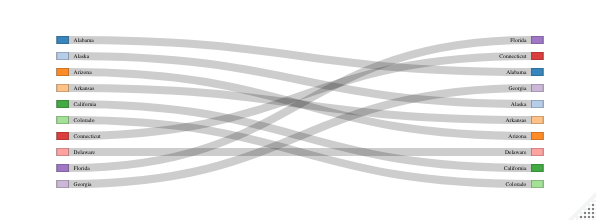
I would like to visualize a rank change (i.e. change of the relative order) of US states using a Sankey flow graph. I'm using the networkd3 package and came up with the following:
library(dplyr)
library(networkD3)

df <- data_frame(origins=state.name[1:10], destinations=state.name[1:10])
lab <- c(df$origins, df$destinations)
nodes <- data.frame(node=c(0:9), name=lab)
links <- data.frame(source=c(0:9), target=c(10:19), value=rep(1,10))
sankeyNetwork(Links = links, Nodes = nodes, Source = 'source',
              Target = 'target', Value = 'value', NodeID = 'name')
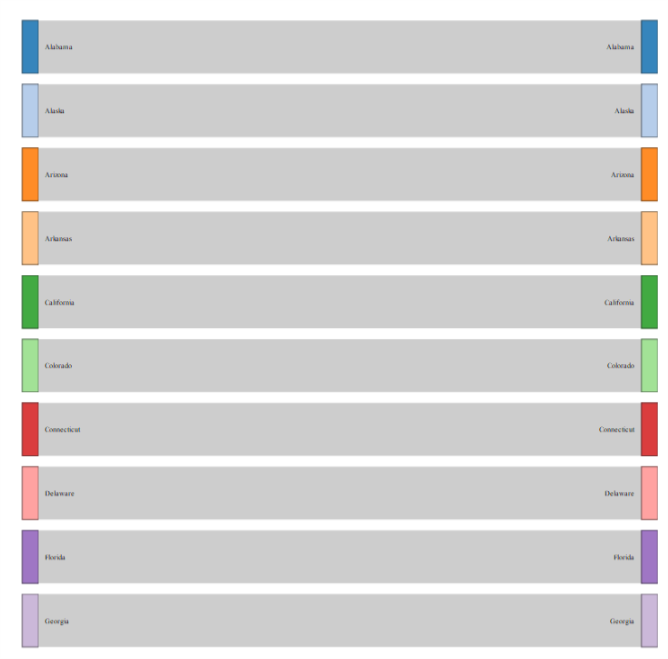
This snippet produces the following graph:
Sankey flow graph of US states

I can change the relative order by hand now. However, I wonder whether it is possible to fix the order on the right-hand side and put e.g. Alabama on rank 3, California on rank 1, etc ...

