Unfortunately, it still does not seem that you can set different background colors for the different subplots directly:
The background color is set in layout for the figure:
plot_bgcolor='rgb(245,245,240)'. At the moment you cannot change the
backround of a particular subplot.
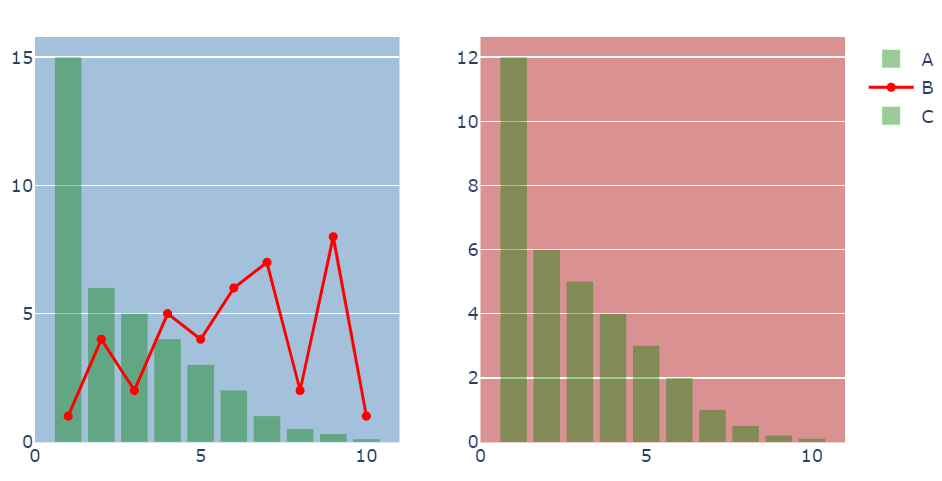
BUT you are free to place shapes anywhere you'd like on both subplots by referencing both x axes through xref=x and xref=x2 in fig.update_layout(shapes=dict()). And if you make sure to tweak a few other parameters as well like the zeroline and layer='below' you'll get a result thats pretty good:
![enter image description here]()
Complete code:
# imports
from plotly.subplots import make_subplots
import plotly.graph_objects as go
import pandas as pd
import numpy as np

# data
df = pd.DataFrame({'Index': {0: 1.0,
                              1: 2.0,
                              2: 3.0,
                              3: 4.0,
                              4: 5.0,
                              5: 6.0,
                              6: 7.0,
                              7: 8.0,
                              8: 9.0,
                              9: 10.0},
                             'A': {0: 15.0,
                              1: 6.0,
                              2: 5.0,
                              3: 4.0,
                              4: 3.0,
                              5: 2.0,
                              6: 1.0,
                              7: 0.5,
                              8: 0.3,
                              9: 0.1},
                             'B': {0: 1.0,
                              1: 4.0,
                              2: 2.0,
                              3: 5.0,
                              4: 4.0,
                              5: 6.0,
                              6: 7.0,
                              7: 2.0,
                              8: 8.0,
                              9: 1.0},
                             'C': {0: 12.0,
                              1: 6.0,
                              2: 5.0,
                              3: 4.0,
                              4: 3.0,
                              5: 2.0,
                              6: 1.0,
                              7: 0.5,
                              8: 0.2,
                              9: 0.1}})
# set up plotly figure
fig = make_subplots(1,2)

# add first bar trace at row = 1, col = 1
fig.add_trace(go.Bar(x=df['Index'], y=df['A'],
                     name='A',
                     marker_color = 'green',
                     opacity=0.4,
                     marker_line_color='rgba(0,0,0,0)',
                     marker_line_width=2),
              row = 1, col = 1)

# add first scatter trace at row = 1, col = 1
fig.add_trace(go.Scatter(x=df['Index'], y=df['B'], line=dict(color='red'), name='B'),
              row = 1, col = 1)

# add first bar trace at row = 1, col = 2
fig.add_trace(go.Bar(x=df['Index'], y=df['C'],
                     name='C',
                     marker_color = 'green',
                     opacity=0.4,
                     marker_line_color='rgba(0,0,0,0)',
                    marker_line_width=2),
              row = 1, col = 2)

fig.update_layout(plot_bgcolor='rgba(0,0,0,0)')

# Define gridlines and zerolines
# => an invisible zerolines looks better
# in this scenario
fig.update_layout(xaxis=dict(showgrid=False, zeroline=False),
                  yaxis=dict(showgrid=True, zeroline=False),
                  xaxis2=dict(showgrid=False, zeroline=False),
                  yaxis2=dict(showgrid=True, zeroline=False),

)

fig.update_layout(
    shapes=[
        # 1st highlight during Feb 4 - Feb 6
 dict(
            type="rect",
            xref="x",
            yref="paper",
            x0=df['Index'].iloc[0]-1,
            y0=-0.001,
            x1=df.index[-1]+2,
            y1=1,
            fillcolor="steelblue",
            opacity=0.5,
            layer="below",
            line_width=0,
        ),
        # 2nd highlight during Feb 20 - Feb 23
        dict(
            type="rect",
            xref="x2",
            yref="paper",
            x0=df['Index'].iloc[0]-1,
            y0=-0.001,
            x1=df.index[-1]+2,
            y1=1,
            fillcolor="firebrick",
            opacity=0.5,
            layer="below",
            line_width=0,
        )
    ]
)

fig.show()

