Has anyone succeeded in generating code coverage for Go unit tests? I can't find a tool for that on the web.
Note that Go 1.2 (Q4 2013, rc1 is available) will now display test coverage results:
One major new feature of
go testis that it can now compute and, with help from a new, separately installed "go tool cover" program, display test coverage results.The
covertool is part of thego.toolssubrepository. It can be installed by running$ go get golang.org/x/tools/cmd/coverThe cover tool does two things.
First, when "
go test" is given the-coverflag, it is run automatically to rewrite the source for the package and insert instrumentation statements. The test is then compiled and run as usual, and basic coverage statistics are reported:$ go test -coverprofile fmtcoverage.html fmt ok fmt 0.060s coverage: 91.4% of statements $
Second, for more detailed reports, different flags to "go test" can create a coverage profile file, which the cover program, invoked with "
go tool cover", can then analyze.
The latest versions of Go (2013/09/19) use:
go test -coverprofile <filename> <package name>Details on how to generate and analyze coverage statistics can be found by running the commands
$ go help testflag
$ go tool cover -help
Ivan Black mentions in the comments:
go test -coverprofile cover.outand then
go tool cover -html=cover.outopenscover.outin your default browserI don't even want to wait for the browser to open, so I defined this alias:
alias gc=grep -v -e " 1$" cover.outThat I just type
gc, and have a list of all the lines not yet covered (here: with acoverage.outline not ending with "1").
Update 2022, possibly for Go 1.19
proposal: extend Go's code coverage testing to include applications
While the existing "
go test" based coverage workflow will continue to be supported, the proposal is to add coverage as a new build mode for "go build".In the same way that users can build a race-detector instrumented executable using "
go build -race", it will be possible to build a coverage-instrumented executable using "go build -cover".Merging coverage profiles produced in different GOOS/GOARCH environments will be supported.
Update March 2023, Go 1.20: "Code coverage for Go integration tests" shows that you can now build coverage-instrumented programs using “go build -cover”, then feed these instrumented binaries into an integration test to extend the scope of coverage testing.
go test -coverprofile <filename> <package name> –
Sumer go test -coverprofile cover.out and then go tool cover -html=cover.out -o cover.html open cover.html in browser –
Hussar go tool cover -html=cover.out will automatically opens a browser, but it doesn't work for my system. I prefer to keep a browser open and refresh the page if necessary. –
Hussar go tool cover has moved to new URL, so please use command go get golang.org/x/tools/cmd/cover instead. –
Somersault go test ./... -coverprofile=cover.out you get the following error: cannot use test profile flag with multiple packages. There's still an open issue to add support for this. –
Marchetti In addition to the good answers above, I find these three lines to be the simplest way to get it (which includes all packages):
go test -v -coverprofile cover.out ./YOUR_CODE_FOLDER/...
go tool cover -html cover.out -o cover.html
open cover.html
Note that in the HTML file you will find a dropdown button that will direct you to all files.
See go tool cover -help for additional options.
open cover.html works fine but it generates unwanted listener logs in the same terminal in ubuntu as follows bash Gtk-Message: 00:03:41.903: Failed to load module "canberra-gtk-module" Gtk-Message: 00:03:41.904: Failed to load module "canberra-gtk-module" –
Withhold ... is used for recursively search for inner folders. –
Tansy Go comes with awesome tool for testing and coverage. Although all Go tools are well documented go tool cover -help I would suggest reading The cover story article on the official Go blog. It has plenty of examples and I strongly recommend it!
I have this function in my ~/.bash_profile. (you can just paste it in the terminal to give it a try).
cover () {
    t="/tmp/go-cover.$$.tmp"
    go test -coverprofile=$t $@ && go tool cover -html=$t && unlink $t
}
Then just cd into a go project/package folder and type cover.
This opens a visual tool in browser which shows you the tested and untested code for each file in the current package. Very useful command! I strongly recommend it for finding what is not 100% tested yet! The shown results are per file. From a drop down in top-left you can see results for all files.
With this command you can also check the coverage of any package for example:
cover fmt
The output in terminal from this command would be:
ok fmt 0.031s coverage: 91.9% of statements
In addition to that in your browser you will see this tool showing in red all lines of code which are not covered with tests:

It is also possible to just save the html coverage file instead of opening it in a browser. This is very useful in cases when your tests + coverage is run by CI tool like Jenkins. That way you can serve the coverage files from a central server and the whole team will be able to see the coverage results for each build.
cat cover.out.html | grep '<option value="file' | sed -E 's/.*>(.*) \((.*)%\)<.*/\2 \1/' | sort -rn –
Mag Simply run
go test -cover
or
go test -cover ./...
or
go test -coverprofile=coverage.out ./... ; go tool cover -func=coverage.out
or to check the source code
go test -coverprofile=coverage.out ./... ; go tool cover -html=coverage.out
I can't find a tool for that on the web.
Actually... there is now (2022) such a tool on the web, from Nikolay Dubina's project go-cover-treemap-web:
Nothing it uploaded (the processing remains local), but by dragging/dropping your coverprofile, the Web UI (using Go WASM) will run go-cover-treemap and display:

(gocovergage for https://github.com/gohugoio/hugo)
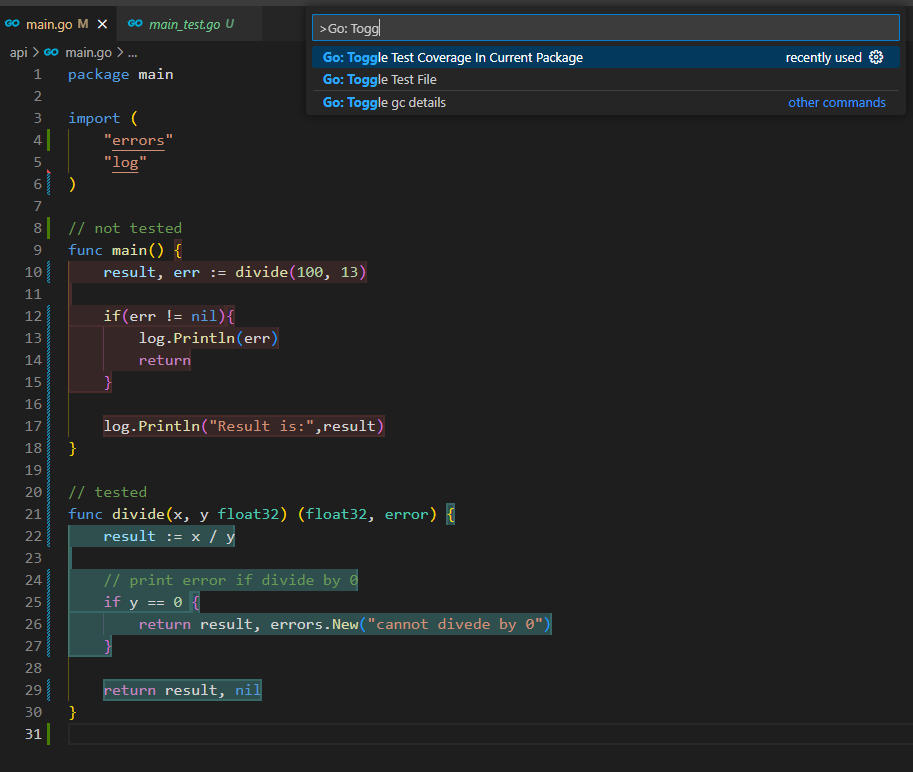
Already built-in in VSCode
- Ctrl+Shift+P to Open Command Palette
- Go: Toggle Test Coverage ...
The Green part is tested and Red is not
Coverage Report:
a) Run all the tests and enable coverage --> go test ./... -coverprofile coverage.out
b) Get coverage for individual functions as well as overall coverage → go tool cover -func coverage.out
c) See the lines covered and the ones not covered by your tests → go tool cover -html=coverage.out -o coverage.html. Open the coverage.html file hereby generated in the browser and analyze the detailed coverage info.
It's right here, some docs here.
$ go tool
6a
6c
6g
6l
addr2line
api
cgo
cov
dist
ebnflint
fix
gotype
nm
objdump
pack
pprof
prof
vet
yacc
$ go tool cov -h
usage: cov [-lsv] [-g substring] [-m minlines] [6.out args...]
-g specifies pattern of interesting functions or files
go tool cov: exit status 1
$
I haven't used it, this is all I know.
~/go/pkg/tool/linux_amd64 matches my last Go build of yesterday. –
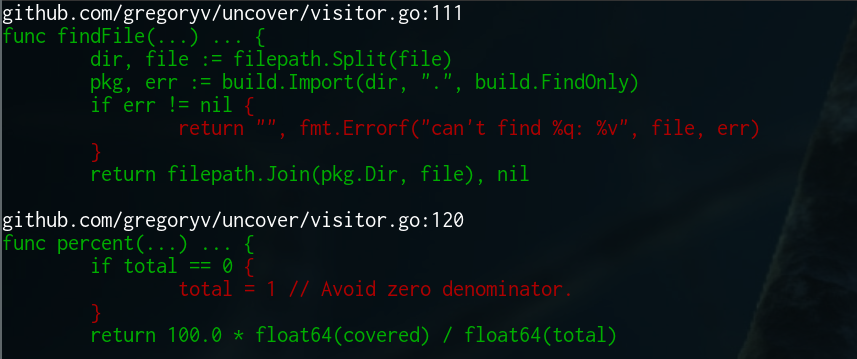
Landward If you like to see the uncovered lines by function directly in a terminal I rewrote the cover tool for this purpose. It's available at https://github.com/gregoryv/uncover.
Usage
go get -u github.com/gregoryv/uncover/...
go test -coverprofile /tmp/c.out
uncover /tmp/c.out
Screenshot
If you are using VSCode this functionality is supported out the box ( But disabled by default )
Just turn on test on save + coverage reporting
https://github.com/microsoft/vscode-go/wiki/On-Save-features
It will even show in your editor which lines are not covered which is super handy.
If you want to find test coverage in Windows, just go to the desired folder in command prompt and type the following command:
go test -coverprofile=coverage.out && go tool cover -html=coverage.out
This is perfectly easy and works reliably.
A quick and easy way is to use the coverage tool that comes with built-in go :
$ go test -coverprofile cp.out // Emits the coverage in one liner percentage wise
After you execute the above command, if you wish to visually see the code coverage (like covered statements and missed etc)
$ go tool cover -html=cp.out
Note : You need to execute the above commands in the folder where you wish to see coverage
Try using gaia-docker/base-go-build Docker Image.
This is a Docker image that contains all you need in order to build and test coverage. Running test coverage inside a Docker container creates .cover folder with test coverage results of your project.
docker run --rm -v "$PWD":$PROJECT_PATH -w $PROJECT_PATH $BUILDER_IMAGE_NAME /go/script/coverage.sh
The test coverage script running on all projects' folders and generates, inside .cover folder junit and coverage reports for each folder, and a combine coverage report of all projects' tests.
Codecov also suggests a script that collect coverage results: multiple files
Test Coverage for Golang
go get github.com/axw/gocov/gocov
go get -u gopkg.in/matm/v1/gocov-html
Check It is Installed Correctly And you have access from your Terminal
Run the Test Case
If you run the test case it will Reder the .json File Based on the file you will get the Code Coverage Report in .html file
gocov test >your_Coverage_report.json
Once Your Test case is done Generate a Report in .html File using .json
gocov-html your_Coverage_report.json >your_Coverage_report.html
Reference
GoTest Coverage Tool for go lang
Alternate Method
Go Native Test coverage
go test -coverprofile=coverage.out
go tool cover -html=coverage.out
© 2022 - 2024 — McMap. All rights reserved.


