How to limit cross correlation window width in Numpy?
Asked Answered
C

8

8

I am learning numpy/scipy, coming from a MATLAB background. The xcorr function in Matlab has an optional argument "maxlag" that limits the lag range from –maxlag to maxlag. This is very useful if you are looking at the cross-correlation between two very long time series but are only interested in the correlation within a certain time range. The performance increases are enormous considering that cross-correlation is incredibly expensive to compute.

In numpy/scipy it seems there are several options for computing cross-correlation. numpy.correlate, numpy.convolve, scipy.signal.fftconvolve. If someone wishes to explain the difference between these, I'd be happy to hear, but mainly what is troubling me is that none of them have a maxlag feature. This means that even if I only want to see correlations between two time series with lags between -100 and +100 ms, for example, it will still calculate the correlation for every lag between -20000 and +20000 ms (which is the length of the time series). This gives a 200x performance hit! Do I have to recode the cross-correlation function by hand to include this feature?

Chinquapin answered 5/6, 2015 at 23:25 Comment(0)
S
9

Here are a couple functions to compute auto- and cross-correlation with limited lags. The order of multiplication (and conjugation, in the complex case) was chosen to match the corresponding behavior of numpy.correlate.

import numpy as np
from numpy.lib.stride_tricks import as_strided


def _check_arg(x, xname):
    x = np.asarray(x)
    if x.ndim != 1:
        raise ValueError('%s must be one-dimensional.' % xname)
    return x

def autocorrelation(x, maxlag):
    """
    Autocorrelation with a maximum number of lags.

    `x` must be a one-dimensional numpy array.

    This computes the same result as
        numpy.correlate(x, x, mode='full')[len(x)-1:len(x)+maxlag]

    The return value has length maxlag + 1.
    """
    x = _check_arg(x, 'x')
    p = np.pad(x.conj(), maxlag, mode='constant')
    T = as_strided(p[maxlag:], shape=(maxlag+1, len(x) + maxlag),
                   strides=(-p.strides[0], p.strides[0]))
    return T.dot(p[maxlag:].conj())


def crosscorrelation(x, y, maxlag):
    """
    Cross correlation with a maximum number of lags.

    `x` and `y` must be one-dimensional numpy arrays with the same length.

    This computes the same result as
        numpy.correlate(x, y, mode='full')[len(a)-maxlag-1:len(a)+maxlag]

    The return vaue has length 2*maxlag + 1.
    """
    x = _check_arg(x, 'x')
    y = _check_arg(y, 'y')
    py = np.pad(y.conj(), 2*maxlag, mode='constant')
    T = as_strided(py[2*maxlag:], shape=(2*maxlag+1, len(y) + 2*maxlag),
                   strides=(-py.strides[0], py.strides[0]))
    px = np.pad(x, maxlag, mode='constant')
    return T.dot(px)

For example,

In [367]: x = np.array([2, 1.5, 0, 0, -1, 3, 2, -0.5])

In [368]: autocorrelation(x, 3)
Out[368]: array([ 20.5,   5. ,  -3.5,  -1. ])

In [369]: np.correlate(x, x, mode='full')[7:11]
Out[369]: array([ 20.5,   5. ,  -3.5,  -1. ])

In [370]: y = np.arange(8)

In [371]: crosscorrelation(x, y, 3)
Out[371]: array([  5. ,  23.5,  32. ,  21. ,  16. ,  12.5,   9. ])

In [372]: np.correlate(x, y, mode='full')[4:11]
Out[372]: array([  5. ,  23.5,  32. ,  21. ,  16. ,  12.5,   9. ])

(It will be nice to have such a feature in numpy itself.)

Salinasalinas answered 1/1, 2016 at 18:47 Comment(1)
please post on www.github.com/numpy/numpy/issues/5954 or www.github.com/numpy/numpy/pull/5978 to show your support for my feature and maybe the necessary steps can get taken to get it included in the next release.Chinquapin
C
5

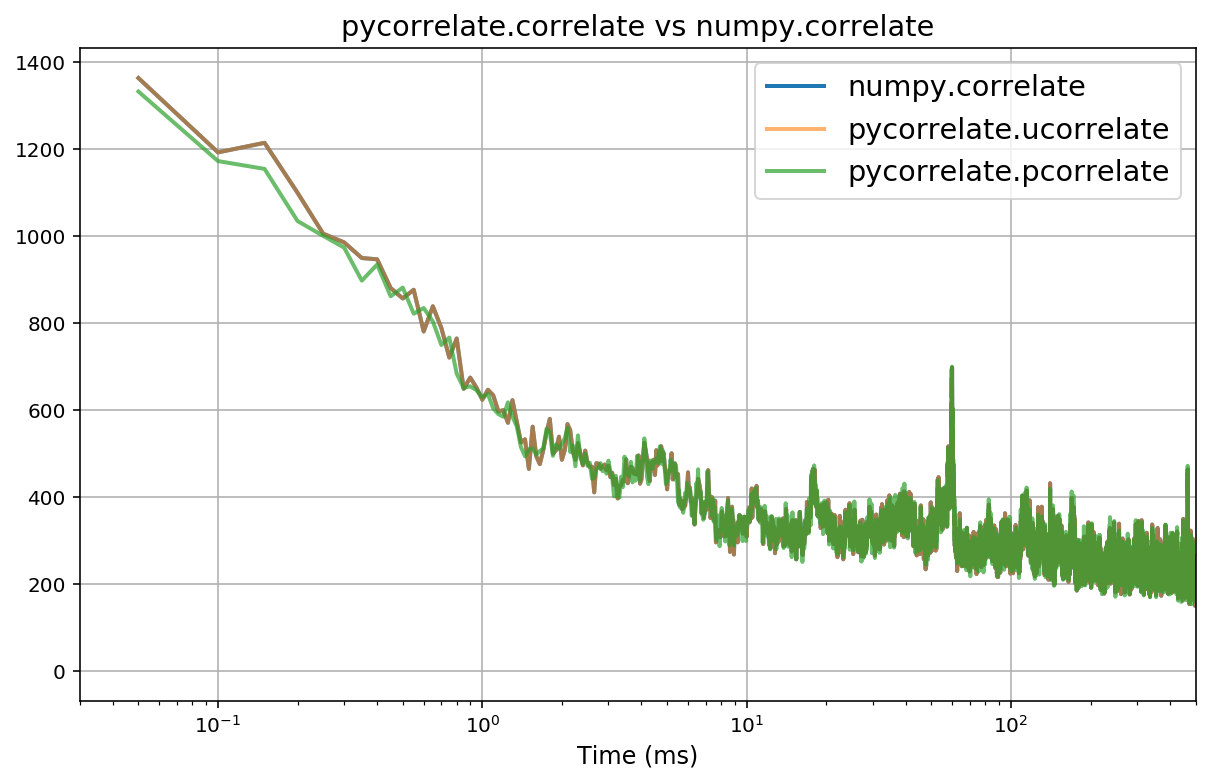
Until numpy implements the maxlag argument, you can use the function ucorrelate from the pycorrelate package. ucorrelate operates on numpy arrays and has a maxlag keyword. It implements the correlation from using a for-loop and optimizes the execution speed with numba.

Example - autocorrelation with 3 time lags:

import numpy as np
import pycorrelate as pyc

x = np.array([2, 1.5, 0, 0, -1, 3, 2, -0.5])
c = pyc.ucorrelate(x, x, maxlag=3)
c

Result:

Out[1]: array([20,  5, -3])

The pycorrelate documentation contains a notebook showing perfect match between pycorrelate.ucorrelate and numpy.correlate:

enter image description here

Castlereagh answered 19/12, 2017 at 19:20 Comment(0)
F
4

matplotlib.pyplot provides matlab like syntax for computating and plotting of cross correlation , auto correlation etc.

You can use xcorr which allows to define the maxlags parameter.

    import matplotlib.pyplot as plt


    import numpy  as np


    data = np.arange(0,2*np.pi,0.01)


    y1 = np.sin(data)


    y2 = np.cos(data)


    coeff = plt.xcorr(y1,y2,maxlags=10)

    print(*coeff)


[-10  -9  -8  -7  -6  -5  -4  -3  -2  -1   0   1   2   3   4   5   6   7
   8   9  10] [ -9.81991753e-02  -8.85505028e-02  -7.88613080e-02  -6.91325329e-02
  -5.93651264e-02  -4.95600447e-02  -3.97182508e-02  -2.98407146e-02
  -1.99284126e-02  -9.98232812e-03  -3.45104289e-06   9.98555430e-03
   1.99417667e-02   2.98641953e-02   3.97518558e-02   4.96037706e-02
   5.94189688e-02   6.91964864e-02   7.89353663e-02   8.86346584e-02
   9.82934198e-02] <matplotlib.collections.LineCollection object at 0x00000000074A9E80> Line2D(_line0)
Fluorite answered 6/6, 2015 at 7:37 Comment(1)
that function is simply a wrapper for numpy.correlate. Unfortunately, while it returns the appropriate length vector, it doesn't have any performance savings since it actually calculates the full cross-correlation and then throws the extra entries out.Chinquapin
S
2

@Warren Weckesser's answer is the best as it leverages numpy to get performance savings (and not just call corr for each lag). Nonetheless, it returns the cross-product (eg the dot product between the inputs at various lags). To get the actual cross-correlation I modified his answer w/ an optional mode argument, which if set to 'corr' returns the cross-correlation as such:

def crosscorrelation(x, y, maxlag, mode='corr'):
    """
    Cross correlation with a maximum number of lags.

    `x` and `y` must be one-dimensional numpy arrays with the same length.

    This computes the same result as
        numpy.correlate(x, y, mode='full')[len(a)-maxlag-1:len(a)+maxlag]

    The return vaue has length 2*maxlag + 1.
    """
    py = np.pad(y.conj(), 2*maxlag, mode='constant')
    T = as_strided(py[2*maxlag:], shape=(2*maxlag+1, len(y) + 2*maxlag),
                   strides=(-py.strides[0], py.strides[0]))
    px = np.pad(x, maxlag, mode='constant')
    if mode == 'dot':       # get lagged dot product
        return T.dot(px)
    elif mode == 'corr':    # gets Pearson correlation
        return (T.dot(px)/px.size - (T.mean(axis=1)*px.mean())) / \
               (np.std(T, axis=1) * np.std(px))
Showers answered 11/5, 2020 at 22:19 Comment(2)
replaced as_strided with np.lib.stride_tricks.as_strided (see gormanalysis.com/blog/…)Downstroke
'Nonetheless, it returns the cross-product (eg the dot product between the inputs at various lags).' - cross product is not an alias for dot product (a.k.a. scalar product, inner product).Theirs
B
1

I encountered the same problem some time ago, I paid more attention to the efficiency of calculation.Refer to the source code of MATLAB's function xcorr.m, I made a simple one.

import numpy as np
from scipy import signal, fftpack
import math
import time

def nextpow2(x):
    if x == 0:
        y = 0
    else:
        y = math.ceil(math.log2(x))
    return y


def xcorr(x, y, maxlag):
    m = max(len(x), len(y))
    mx1 = min(maxlag, m - 1)
    ceilLog2 = nextpow2(2 * m - 1)
    m2 = 2 ** ceilLog2

    X = fftpack.fft(x, m2)
    Y = fftpack.fft(y, m2)
    c1 = np.real(fftpack.ifft(X * np.conj(Y)))
    index1 = np.arange(1, mx1+1, 1) + (m2 - mx1 -1)
    index2 = np.arange(1, mx1+2, 1) - 1
    c = np.hstack((c1[index1], c1[index2]))
    return c


if __name__ == "__main__":
    s = time.clock()
    a = [1, 2, 3, 4, 5]
    b = [6, 7, 8, 9, 10]
    c = xcorr(a, b, 3)
    e = time.clock()
    print(c)
    print(e-c)

Take the results of a certain run as an exmple:

[ 29.  56.  90. 130. 110.  86.  59.]
0.0001745000000001884

comparing with MATLAB code:

clear;close all;clc
tic
a = [1, 2, 3, 4, 5];
b = [6, 7, 8, 9, 10];
c = xcorr(a, b, 3)
toc

   29.0000   56.0000   90.0000  130.0000  110.0000   86.0000   59.0000

时间已过 0.000279 秒。

If anyone can give a strict mathematical derivation about this,that would be very helpful.

Base answered 16/2, 2020 at 5:27 Comment(0)
I
0

I think I have found a solution, as I was facing the same problem:

If you have two vectors x and y of any length N, and want a cross-correlation with a window of fixed len m, you can do:

x = <some_data>
y = <some_data>

# Trim your variables
x_short = x[window:]
y_short = y[window:]

# do two xcorrelations, lagging x and y respectively
left_xcorr = np.correlate(x, y_short)  #defaults to 'valid'
right_xcorr = np.correlate(x_short, y) #defaults to 'valid'

# combine the xcorrelations
# note the first value of right_xcorr is the same as the last of left_xcorr
xcorr = np.concatenate(left_xcorr, right_xcorr[1:])

Remember you might need to normalise the variables if you want a bounded correlation

Intake answered 5/12, 2015 at 20:18 Comment(2)
your xcorr value for 0 lag is not going to be the same as the true xcorr value because you have thrown out some of your data. check it agains the full xcorr and see. What you can do is post on github.com/numpy/numpy/issues/5954 or github.com/numpy/numpy/pull/5978 to show your support for my feature and maybe the necessary steps can get taken to get it included in the next release.Chinquapin
Agree, this should have been added way backIntake
I
0

Here is another answer, sourced from here, seems faster on the margin than np.correlate and has the benefit of returning a normalised correlation:

def rolling_window(self, a, window):
    shape = a.shape[:-1] + (a.shape[-1] - window + 1, window)
    strides = a.strides + (a.strides[-1],)
    return np.lib.stride_tricks.as_strided(a, shape=shape, strides=strides)

def xcorr(self, x,y):

    N=len(x)
    M=len(y)
    meany=np.mean(y)
    stdy=np.std(np.asarray(y))
    tmp=self.rolling_window(np.asarray(x),M)
    c=np.sum((y-meany)*(tmp-np.reshape(np.mean(tmp,-1),(N-M+1,1))),-1)/(M*np.std(tmp,-1)*stdy)

    return c        
Intake answered 6/12, 2015 at 0:32 Comment(0)
M
0

as I answered here, https://mcmap.net/q/1322930/-specify-lag-in-numpy-correlate matplotlib.xcorr has the maxlags param. It is actually a wrapper of the numpy.correlate, so there is no performance saving. Nevertheless it gives exactly the same result given by Matlab's cross-correlation function. Below I edited the code from matplotlib so that it will return only the correlation. The reason is that if we use matplotlib.corr as it is, it will return the plot as well. The problem is, if we put complex data type as the arguments into it, we will get "casting complex to real datatype" warning when matplotlib tries to draw the plot.

<!-- language: python -->

import numpy as np
import matplotlib.pyplot as plt

def xcorr(x, y, maxlags=10):
    Nx = len(x)
    if Nx != len(y):
        raise ValueError('x and y must be equal length')

    c = np.correlate(x, y, mode=2)

    if maxlags is None:
        maxlags = Nx - 1

    if maxlags >= Nx or maxlags < 1:
        raise ValueError('maxlags must be None or strictly positive < %d' % Nx)

    c = c[Nx - 1 - maxlags:Nx + maxlags]

    return c
Mcgovern answered 20/12, 2017 at 1:34 Comment(0)

© 2022 - 2024 — McMap. All rights reserved.