reduce line width of seaborn pointplot
Asked Answered
E

2

8
import seaborn as sns
sns.set(style="ticks")
exercise = sns.load_dataset("exercise")
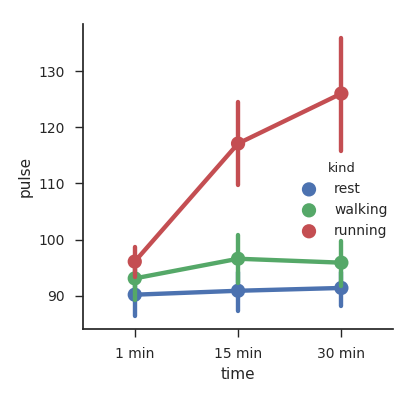
g = sns.factorplot(x="time", y="pulse", hue="kind", data=exercise)

In the plot above, if I specify scale as 0.5, it reduces line width but not width of confidence interval lines. Is there a way to reduce width of confidence interval lines?

Essequibo answered 7/8, 2017 at 6:49 Comment(0)
R
6

You may get linewidth of first line and set it for all other lines of factor plot:

import seaborn as sns
import matplotlib.pylab as plt
sns.set(style="ticks")
exercise = sns.load_dataset("exercise")
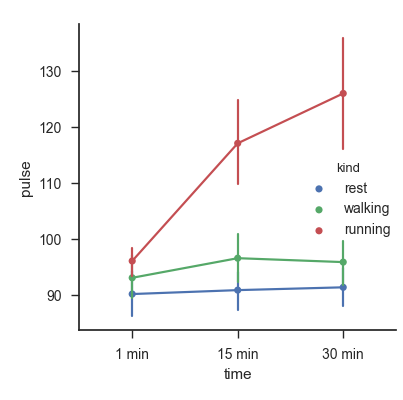
g = sns.factorplot(x="time", y="pulse", hue="kind", data=exercise, scale=.5)
lw = g.ax.lines[0].get_linewidth() # lw of first line
plt.setp(g.ax.lines,linewidth=lw)  # set lw for all lines of g axes

plt.show()

enter image description here

And you can set line width for every line in a cycle:

for l in g.ax.lines:
    print(l.get_linewidth())
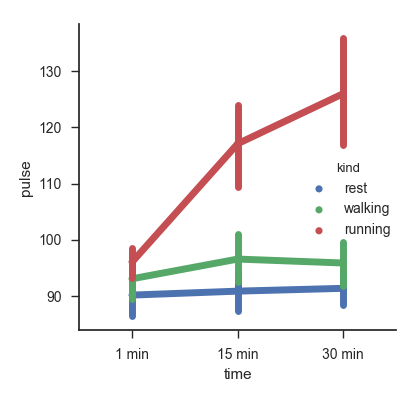
    plt.setp(l,linewidth=5)

Output:

1.575
3.15
3.15
3.15
1.575
3.15
3.15
3.15
1.575
3.15
3.15
3.15

Bold lines are according to confidential intervals.

After set line width to 5 all lines became the same:

enter image description here

Roberto answered 7/8, 2017 at 8:40 Comment(0)
W
15

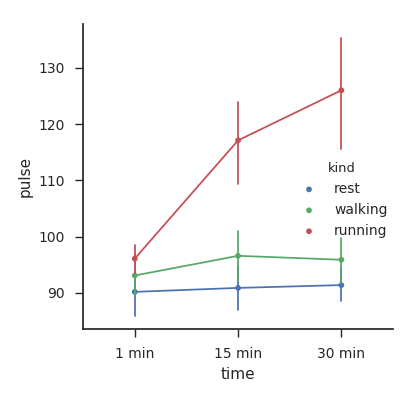
If you want to change the width of all lines (except axes) in the plot, you can simply change the parameter "lines.linewidth" in the matplotlib rcparam through seaborns set function. Simply add rc={"lines.linewidth":0.7} as a parameter in your call of sns.set. Likewise you can also change all (or at least most) of the default design options.

Example:

import seaborn as sns
sns.set(style="ticks", rc={"lines.linewidth": 0.7})
exercise = sns.load_dataset("exercise")
g = sns.factorplot(x="time", y="pulse", hue="kind", data=exercise)

This results in the following plot:

enter image description here

The original plot (without rc={"lines.linewidth":0.7}) was:

enter image description here

Washtub answered 7/8, 2017 at 8:34 Comment(0)
R
6

You may get linewidth of first line and set it for all other lines of factor plot:

import seaborn as sns
import matplotlib.pylab as plt
sns.set(style="ticks")
exercise = sns.load_dataset("exercise")
g = sns.factorplot(x="time", y="pulse", hue="kind", data=exercise, scale=.5)
lw = g.ax.lines[0].get_linewidth() # lw of first line
plt.setp(g.ax.lines,linewidth=lw)  # set lw for all lines of g axes

plt.show()

enter image description here

And you can set line width for every line in a cycle:

for l in g.ax.lines:
    print(l.get_linewidth())
    plt.setp(l,linewidth=5)

Output:

1.575
3.15
3.15
3.15
1.575
3.15
3.15
3.15
1.575
3.15
3.15
3.15

Bold lines are according to confidential intervals.

After set line width to 5 all lines became the same:

enter image description here

Roberto answered 7/8, 2017 at 8:40 Comment(0)

© 2022 - 2024 — McMap. All rights reserved.