I've only been using Python for about a month now, so I'm sorry if there's some simple solution to this that I overlooked.
Basically I have a figure with 4 subplots, the 2 on the left show longitudinal plots and the ones on the right show scatter plots at certain points of the longitudinal plots. You can click through the scatter plots at different points of the longitudinal plot with buttons, and the tick label of the longitudinal plot you're currently at will be highlighted in blue.
Coloring a certain tick label already works with this:
xlabels = []
labelcolors = []

for i, item in enumerate(mr.segmentlst):
    if re.search('SFX|MC|MQ|MS|MKC', item):
        xlabels.append(mr.segmentlst[i])
    else:
        xlabels.append('')

for i, item in enumerate(mr.segmentlst):
    if re.search('SFX', item):
        labelcolors.append('black')
    else:
        labelcolors.append('gray')

labelcolors[self.ind]='blue'

[t.set_color(i) for (i,t) in zip(labelcolors, ax1.xaxis.get_ticklabels())]
[t.set_color(i) for (i,t) in zip(labelcolors, ax2.xaxis.get_ticklabels())]
It only shows certain tick labels and changes their colors accordingly (I don't know if there is another solution for this, it's the only one I could find). Don't mind the mr.segmentlist, I've currently hardcoded the plot to use an attribute from another method so I can easily keep testing it in Spyder.
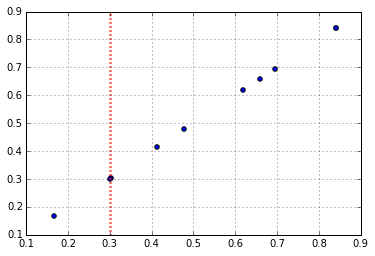
I'd like to also change the grid line color of the currently highlighted tick label (only xgridlines are visible) in the longitudinal plots, is there some kind of similar way of doing this? I've searched the internet for a solution for about 2 hours now and didn't really find anything helpful.
I thought something like ax1.get_xgridlines() might be used, but I have no idea how I could transform it into a useful list.
Thanks, Tamara

