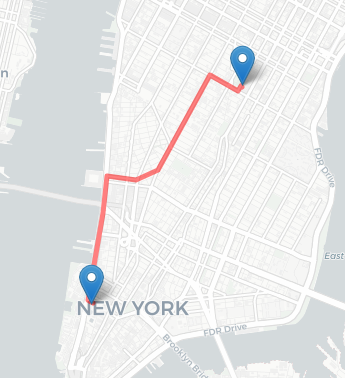
below is an example of finding route, travel time and travel distance from 'One World Trade Center, NYC' to 'Madison Square Park, NYC' using osrm package in R. (I learnt it from Road Routing in R). The travel time here is 10.37 minutes.
I wanted to create an video for visualization.
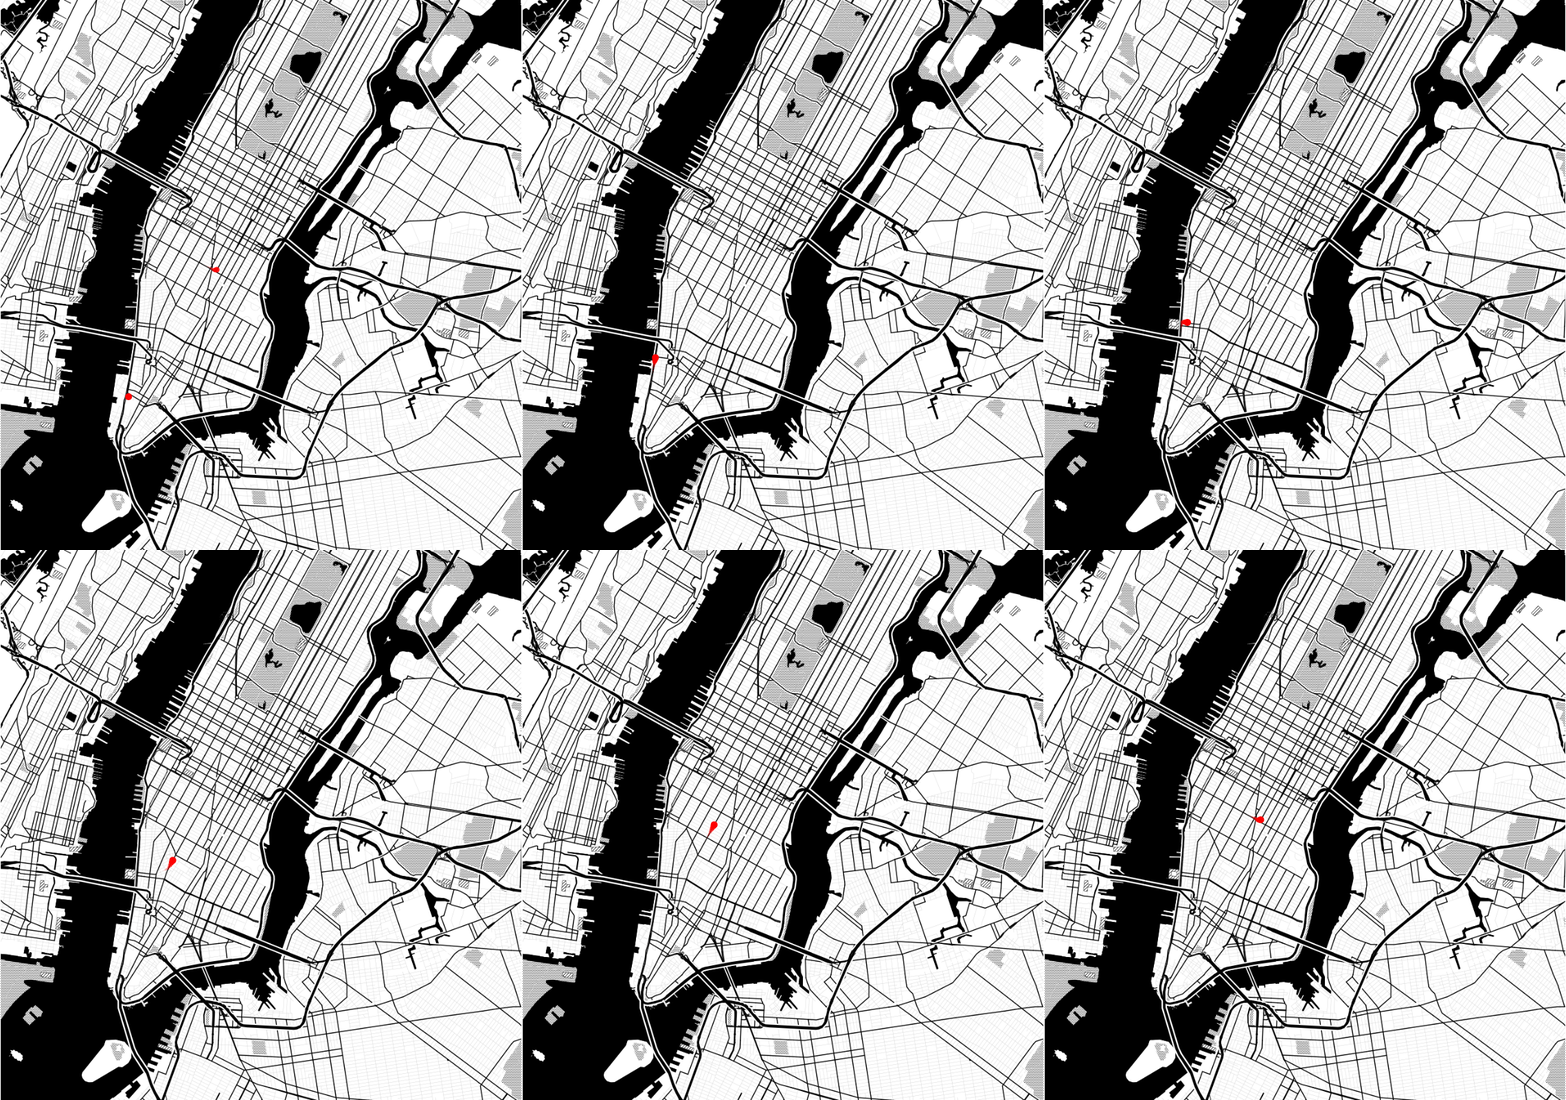
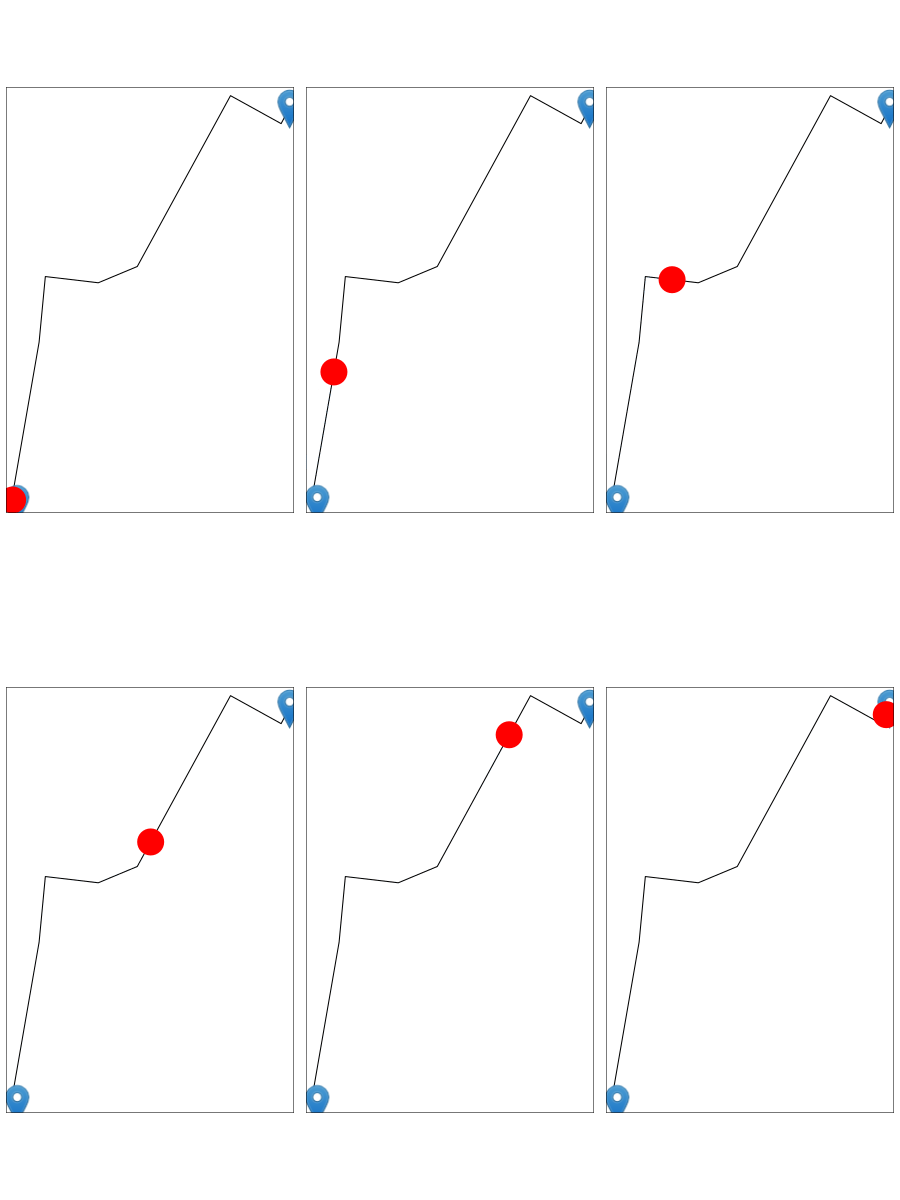
Q. How can I create an animation of vehicle (represented by a marker) moving from 'One World Trade Center, NYC' to 'Madison Square Park, NYC' along the route ?
Ideally, we should know the speed in each road segment. But lets assume the vehicle moves non-stop at constant speed (= distance/time) between two location.
We can simply use tmap instead of leaflet also to create animation.
library(sf)
library(dplyr)
library(tidygeocoder)
library(osrm)

# 1. One World Trade Center, NYC
# 2. Madison Square Park, NYC
adresses <- c("285 Fulton St, New York, NY 10007",
            "11 Madison Ave, New York, NY 10010")

# geocode the two addresses & transform to {sf} data structure
data <- tidygeocoder::geo(adresses, method = "osm") %>%
  st_as_sf(coords = c("long", "lat"), crs = 4326)

osroute <- osrm::osrmRoute(loc = data,
                           returnclass = "sf")

summary(osroute)


library(leaflet)

leaflet(data = data) %>%
  addProviderTiles("CartoDB.Positron") %>%
  addMarkers(label = ~address) %>%
  addPolylines(data = osroute,
               label = "OSRM engine",
               color = "red")


