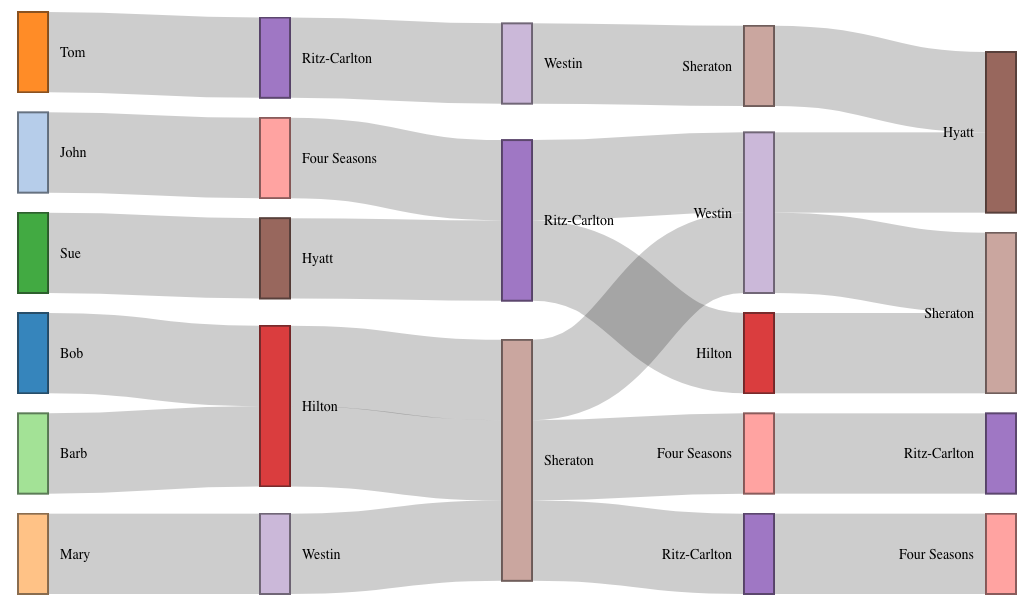
This question comes up a lot... how to convert a dataset that has multiple links/edges defined on each row across several columns. Here's how I convert that into the type of dataset that sankeyNetwork (and many other packages that deal with edges/links/network data) uses... a dataset with one edge/link per row.
starting with an example dataset...
df <- read.table(header = TRUE, stringsAsFactors = FALSE, text = '
name  year1           year2         year3           year4
Bob   Hilton          Sheraton      Westin          Hyatt
John  "Four Seasons"  Ritz-Carlton  Westin          Sheraton
Tom   Ritz-Carlton    Westin        Sheraton        Hyatt
Mary  Westin          Sheraton      "Four Seasons"  Ritz-Carlton
Sue   Hyatt           Ritz-Carlton  Hilton          Sheraton
Barb  Hilton          Sheraton      Ritz-Carlton    "Four Seasons"
')

#   name        year1        year2        year3        year4
# 1  Bob       Hilton     Sheraton       Westin        Hyatt
# 2 John Four Seasons Ritz-Carlton       Westin     Sheraton
# 3  Tom Ritz-Carlton       Westin     Sheraton        Hyatt
# 4 Mary       Westin     Sheraton Four Seasons Ritz-Carlton
# 5  Sue        Hyatt Ritz-Carlton       Hilton     Sheraton
# 6 Barb       Hilton     Sheraton Ritz-Carlton Four Seasons
- create a row number so that you'll still be able to determine which row/observation each individual link came from when you convert the data to long format
- use
tidyr's pivot_longer() function to convert the dataset to long format
- convert the column name variable to the index/number of the column in the original dataset
- grouped by row (each observation in the original dataset), create a variable for each source node's "target" by setting it to the node following it in the next column
- filter out any rows that have
NA for "target" (nodes in the last column of the original dataset will not have a "target", and therefore those rows do not specify a link)
library(dplyr)
library(tidyr)

links <-
  df %>%
  mutate(row = row_number()) %>%  # add a row id
  pivot_longer(-row, names_to = "column", values_to = "source") %>%  # gather all columns
  mutate(column = match(column, names(df))) %>%  # convert col names to col ids
  group_by(row) %>%
  mutate(target = lead(source, order_by = column)) %>%  # get target from following node in row
  ungroup() %>%
  filter(!is.na(target))  # remove links from last column in original data

# # A tibble: 24 x 4
#      row column source       target
#    <int>  <int> <chr>        <chr>
#  1     1      1 Bob          Hilton
#  2     1      2 Hilton       Sheraton
#  3     1      3 Sheraton     Westin
#  4     1      4 Westin       Hyatt
#  5     2      1 John         Four Seasons
#  6     2      2 Four Seasons Ritz-Carlton
#  7     2      3 Ritz-Carlton Westin
#  8     2      4 Westin       Sheraton
#  9     3      1 Tom          Ritz-Carlton
# 10     3      2 Ritz-Carlton Westin
# # … with 14 more rows
Now the data is already in the typical network data format of one link per row defined by "source" and "target" columns, and it could be used with the sankeyNetwork(). However, you will likely want nodes referring to the same thing appearing multiple times within your plot... if someone visited the Hilton in year 1, and then visited the Hilton again in year 3, you will probably want 2 separate nodes, both named Hilton, but appearing in different parts of the plot. In order to do that, you will have to identify each node in your "source" and "target" columns with the year in which they were visited. That's where keeping the "row" and "column" variables around will come in handy.
Append the column index to the "source" name, and append the column index + 1 to the "target" name, and now you will be able to distinguish, for instance, between the node for Hilton which was visited in year 1 and the node for Hilton that was visited in year 3.
links <-
  links %>%
  mutate(source = paste0(source, '_', column)) %>%
  mutate(target = paste0(target, '_', column + 1)) %>%
  select(source, target)

# # A tibble: 24 x 2
#    source         target
#    <chr>          <chr>
#  1 Bob_1          Hilton_2
#  2 Hilton_2       Sheraton_3
#  3 Sheraton_3     Westin_4
#  4 Westin_4       Hyatt_5
#  5 John_1         Four Seasons_2
#  6 Four Seasons_2 Ritz-Carlton_3
#  7 Ritz-Carlton_3 Westin_4
#  8 Westin_4       Sheraton_5
#  9 Tom_1          Ritz-Carlton_2
# 10 Ritz-Carlton_2 Westin_3
# # … with 14 more rows
Now you can follow the rather standard procedure for using a source-target list of links to build the necessary data frames for sankeyNetwork().
Create a nodes data frame with all the unique nodes found in the "source" and "target" vectors. You can also create a label vector in the nodes data frame that does not include the year/column id suffix.
nodes <- data.frame(name = unique(c(links$source, links$target)))
nodes$label <- sub('_[0-9]*$', '', nodes$name) # remove column id from node label

# # A tibble: 23 x 2
#    name           label
#    <chr>          <chr>
#  1 Bob_1          Bob
#  2 Hilton_2       Hilton
#  3 Sheraton_3     Sheraton
#  4 Westin_4       Westin
#  5 John_1         John
#  6 Four Seasons_2 Four Seasons
#  7 Ritz-Carlton_3 Ritz-Carlton
#  8 Tom_1          Tom
#  9 Ritz-Carlton_2 Ritz-Carlton
# 10 Westin_3       Westin
# # … with 13 more rows
Convert the "source" and "target" vectors in the links data frame to be the 0-based-index of the node in the nodes data frame. Add an arbitrary value for each link in the links data frame since it's required by sankeyNetwork(). Then plot it with sankeyNetwork()!
links$source_id <- match(links$source, nodes$name) - 1
links$target_id <- match(links$target, nodes$name) - 1
links$value <- 1

library(networkD3)

sankeyNetwork(Links = links, Nodes = nodes, Source = 'source_id',
              Target = 'target_id', Value = 'value', NodeID = 'label')
![enter image description here]()


