How to debug code in Sitecore
Asked Answered
E

5

8

I would like to debug the Sitecore code just like asp.net code, but do not know how to.

The solution is outside wwwroot. Using Visual Studio 2013, IIS 10.0, Windows 10, Sitecore 8

Does attaching a process, is all I have to do to be able to debug.

In Visual Studio, when I click on Tools > Attach Process, there is no aspnet_wp.exe or w3wp.exe.

Is there any other process to follow.

Execrative answered 24/3, 2016 at 12:31 Comment(2)
Not sure if this helps, but I've been publishing my code to a local IIS site inside wwwroot. w3wp.exe appears only after I visit the hosted site on localhost. I'm also using Debug > Attach to Process.Peonir
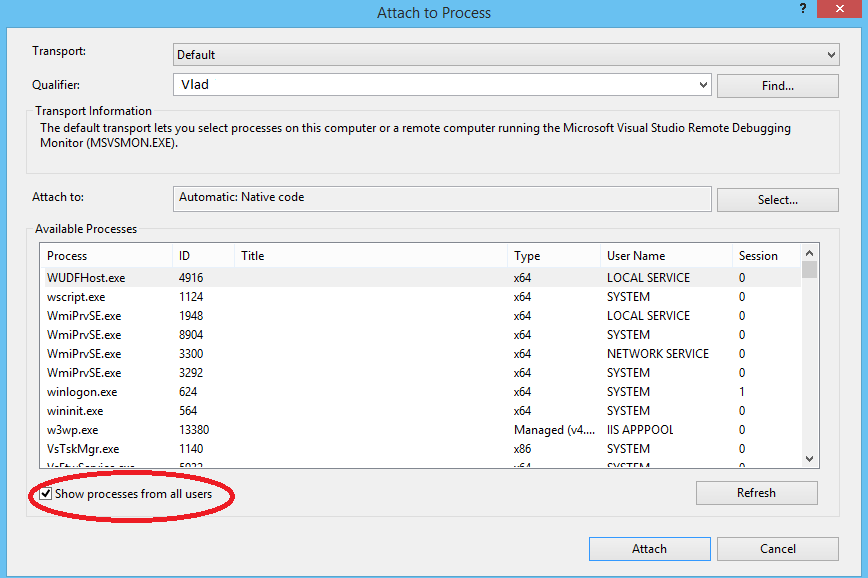
Did you checked Show processes from all users ?Verisimilar
V
13

When you try Debug > Attach to Proces please make sure your site is running. Please also check if "Show Process from all users" is checked. See below picture:

enter image description here

Verisimilar answered 24/3, 2016 at 14:50 Comment(2)
Also make sure you start Visual Studio as a user with admin access using the "Run as Administrator" option.Ditheism
I forgot to mention what @Ditheism wroteVerisimilar
E
9

You can use dotpeek to debug the Sitecore Code.

Steps to debug Sitecore Code:

  1. Download and Install Dotpeek.
  2. Open dotPeek and click on StartSymbolServer default dotPeek uses port 33417.

  3. Open Visual Studio options

  4. In Debugging/Symbols tab click on add new symbol files location and enter http://localhost:33417 (or the port that you assigned in the previous step)

  5. In VS options go to Debugging/General and uncheck “Enable Just My Code” option if it is checked

  6. In dotPeek click on open icon that will show a dialog for loading an assembly

  7. After the assembly is loaded right click on it and click generate pdb. In the appeared window choose the namespaces that you need to debug (or each one as I did) and click Generate Now we are ready for debugging

  8. Open VS and attach to the sitecore process (loading symbols may take longer than usual)

More info: http://bilyukov.com/debugging-sitecore-dotpeek/

Note: You can also export the Sitecore dll to a VS Solution in dotpeek along with its pdb file, then follow the above steps to configure your VS. You need to attach to the Process of the exported Sitecore Solution.

Erbe answered 24/3, 2016 at 12:48 Comment(1)
Good answer. You can also add a breakpoint anywhere in the Sitecore code from Visual Studio by using Debug -> New Breakpoint -> Function Breakpoint. I've also written a similar blog post with step by step instructions for debugging any Sitecore method here: medium.com/@williamchislett/…Romine
D
5

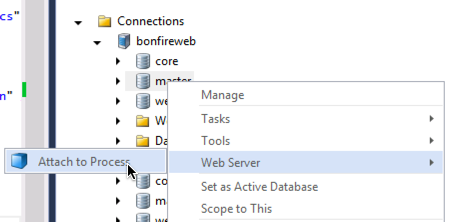
I use Attach to Process in Sitecore rocks.

enter image description here

Sitecore Rocks can be found in the Visual Studio Marketplace via the Tools | Extensions and Updates option in visual studio. Search for Sitecore Rocks in the Online folder.

Dellinger answered 25/3, 2016 at 3:32 Comment(1)
It is unfortunate they appear to have dropped this option in Sitecore 9Dragon
H
0

If you want to attach to w3wp.exe you have to make sure the website is running in IIS under its own app pool with its own domain binded as well as host file updated to associate that domain with localhost 127.0.0.1. If you need more help, along with simplified detailed instructions, please reach out to me.

Hellen answered 5/4, 2016 at 19:40 Comment(0)
H
0

You can do one thing in this case. Go in Visual Studio to Debug > Attach to process....

Now you'll see a window containing available processes. We need to connect to IIS , hence mark the checkbox saying Show processes from all users. Once you do that, you'll find a process w3wp.exe. Jut select it and click Attach.

Honorine answered 6/3, 2018 at 5:49 Comment(0)

© 2022 - 2024 — McMap. All rights reserved.