Unresponsive webpack-internal:// URLs in Chrome Dev Tools Stack Trace
Asked Answered
U

1

9

In my project, which was set up using the Gatsby Quick Start (npm init gatsby my-site-name -- -ts -y), I have the following code for the IndexPage component:

const IndexPage: React.FC<PageProps> = () => {
  throw new Error();
  ...
}

When an error is thrown, Chrome displays a long stack trace that includes webpack-internal:// links, such as:

at IndexPage (webpack-internal:///./src/pages/index.tsx?export=default:123:9)

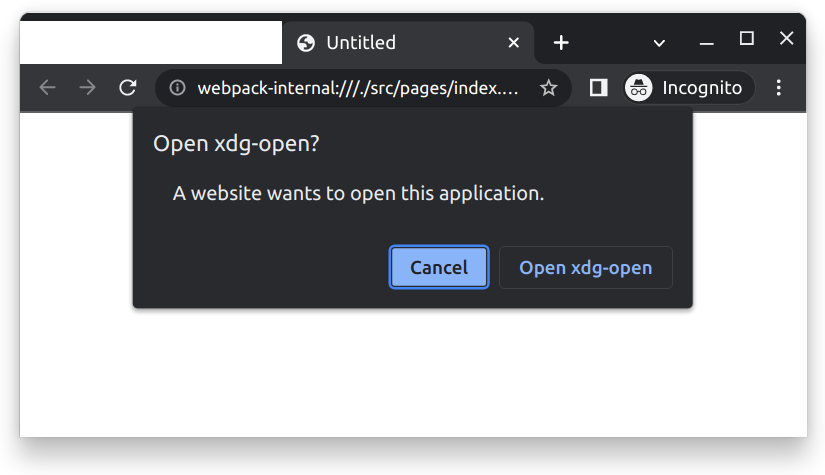
However, when I click on these webpack-internal:// links, Chrome does not open the corresponding file in the Sources tab. How can I fix this issue?

error

Uzzi answered 9/5, 2023 at 2:37 Comment(3)
struggle in the same issueMusteline
It's weird as I didn't have this issue before and nothing has changed with my webpack settings. It does seem like Chrome has updated though..Soliloquize
Browser stack traces do not use source maps. See: #23340051Carve
K
-2

Your build process might not be generating source maps correctly, or you may not have them enabled or Chrome DevTools settings may not be configured correctly to enable source map support.

Try to check your Webpack config or Gatsby's configuration to make sure source maps are being generated and make sure you're using a recent version of Chrome. Also, make sure that the source maps are enabled in DevTools: In Chrome, open DevTools (F12 or Ctrl+Shift+I), click on the settings, then go to the "Sources" tab, and make sure "Enable JavaScript source maps" is checked. Lastly, if none of these helped try to just clear the cache. Hopefully, one of these could help you fix it.

Krigsman answered 14/5, 2023 at 15:57 Comment(0)

© 2022 - 2024 — McMap. All rights reserved.