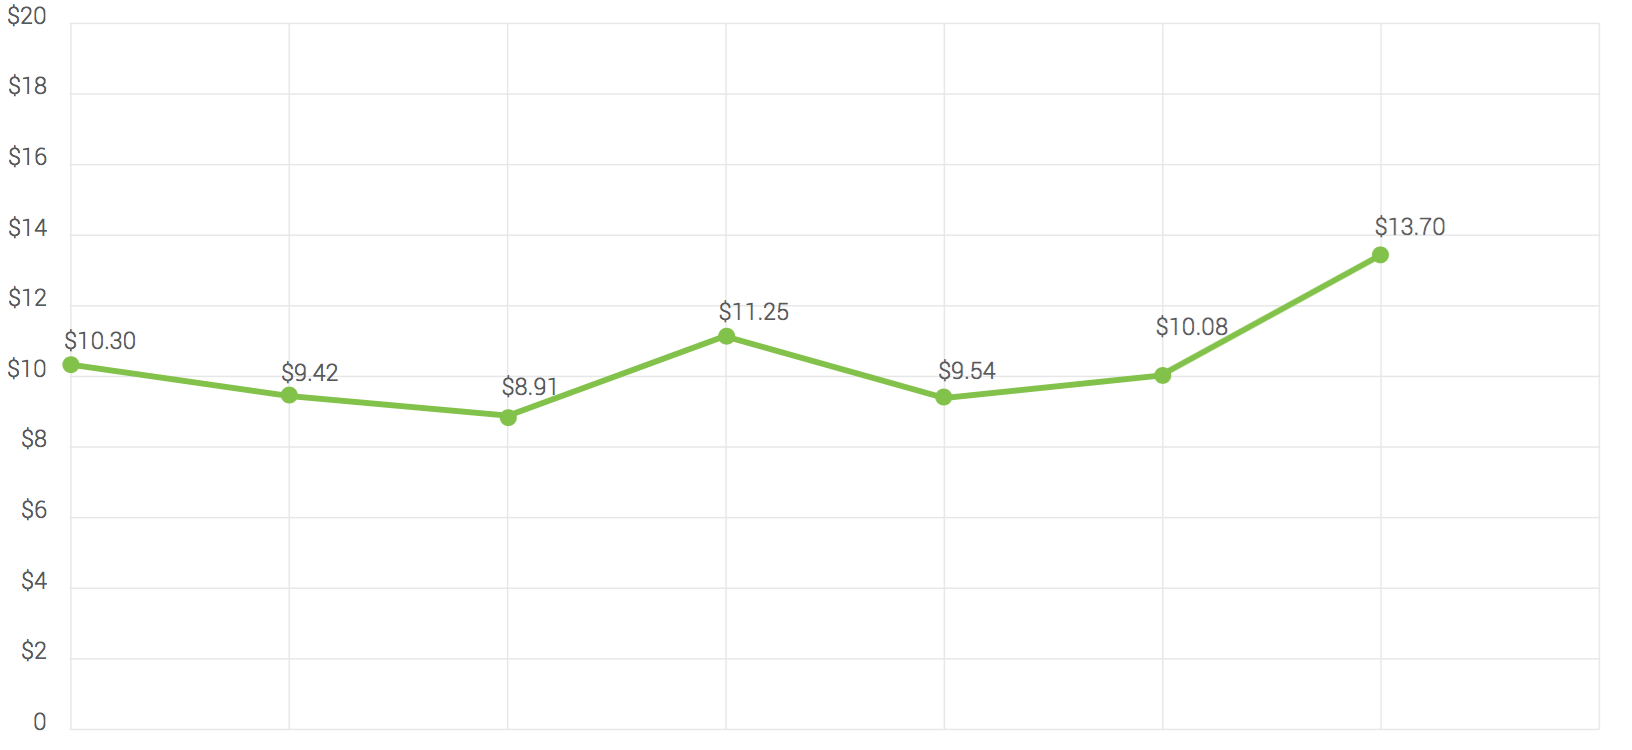
I want to create a LINE chart using angular-nvd3, with each data point has label on top and displaying the data value. I was able to find the option "showValues" and it can work for the discreteBarChart, but that options doesn't seem to work for line chart.
Any help? below is a picture of what I wanted. Update: i know that for a matter of fact the "showValues" is not in the LineChart. But is there any workaround.?

