Using `contain` makes CakePHP 3 find() call slower, while the underlying query itself is still fast
Asked Answered
B

2

9

I have a CakePHP 3 find() call that I've been trying to optimise for a while. I have narrowed it down to these two snippets with the only difference being the contain parameter removed. Timings were measured by DebugKit.

Including contain:

public function qrytest() {
    $table = TableRegistry::get('OrderOptions', array(
        'className' => 'App\Model\Table\Opencart\OrderOptionsTable',
    ));
    $results = $table->find('all', array(
        'fields' => array(
            'OrderOptions.order_product_id',
            'OrderOptions.order_option_id',
            'OrderOptions.value',
        ),
        'conditions' => array(
            'OrderOptions.order_id' => 123,
        ),
        'contain' => array(
            'OpencartProductOptions' => array(
                'OpencartOption',
            ),
            'OpencartOrderProducts' => array(
                'OpencartOrders' => array(
                    'OpencartShippingZone',
                ),
                'OpencartProduct' => array(
                    'OpencartWeightClass',
                ),
            ),
            'OpencartProductOptionValues',
        ),
    ))->all();
    $this->viewBuilder()->template('anEmptyView');
}

Sql Log: 1 / 99 ms; Timer: 4.42 s / 5.72 MB


No contain

public function qrytest() {
    $table = TableRegistry::get('OrderOptions', array(
        'className' => 'App\Model\Table\Opencart\OrderOptionsTable',
    ));
    $results = $table->find('all', array(
        'fields' => array(
            'OrderOptions.order_product_id',
            'OrderOptions.order_option_id',
            'OrderOptions.value',
        ),
        'conditions' => array(
            'OrderOptions.order_id' => 123,
        ),
        // contain parameter removed; nothing else changed
    ))->all();
    $this->viewBuilder()->template('anEmptyView');
}

Sql Log: 1 / 92 ms; Timer: 1.06 s / 4.83 MB


Summary: including the contain parameter makes the controller take almost 5 seconds to render, while not changing the actual query time significantly. Expanding the DebugKit's Timers tab shows Controller action: 4,388.74 ms (screenshots part 1, part 2)


First thing that comes to mind here is optimising joins and indexes, but if you look at the results above, the query itself seems to take the same amount of time in both cases. To confirm, I ran the original query (including JOINs) directly in MySQL Workbench, and it takes about 100 ms, and that matches with what I'm seeing in the DebugKit output. Also I actually did create all required indexes some time ago anyway.

That said, I'm starting to think the problem is not with the MySQL query I have, but with how CakePHP handles it, and this is where I please need help.

I can post the table structure information if you need me to.

Updates

  • No difference between enabled and disabled hydration. Tried both $query->enableHydration(false); and $query->hydrate(false); (as per query-builder.html#getting-arrays-instead-of-entities)
  • Disabled debug by explicitly setting 'debug' => false, still slow: time = 4.30s, measured by the browser
  • Here's the generated query:

    SELECT 
      `OrderOptions`.`order_product_id` AS `OrderOptions__order_product_id`, 
      `OrderOptions`.`order_option_id` AS `OrderOptions__order_option_id`, 
      `OrderOptions`.`value` AS `OrderOptions__value` 
    FROM 
      `order_option` `OrderOptions` 
      LEFT JOIN `product_option` `OpencartProductOptions` ON `OpencartProductOptions`.`product_option_id` = (
        `OrderOptions`.`product_option_id`
      ) 
      LEFT JOIN `option` `OpencartOption` ON `OpencartOption`.`option_id` = (
        `OpencartProductOptions`.`option_id`
      ) 
      LEFT JOIN `order_product` `OpencartOrderProducts` ON `OpencartOrderProducts`.`order_product_id` = (
        `OrderOptions`.`order_product_id`
      ) 
      LEFT JOIN `order` `OpencartOrders` ON `OpencartOrders`.`order_id` = (
        `OpencartOrderProducts`.`order_id`
      ) 
      LEFT JOIN `zone` `OpencartShippingZone` ON `OpencartShippingZone`.`zone_id` = (
        `OpencartOrders`.`shipping_zone_id`
      ) 
      LEFT JOIN `product` `OpencartProduct` ON `OpencartProduct`.`product_id` = (
        `OpencartOrderProducts`.`product_id`
      ) 
      LEFT JOIN `weight_class` `OpencartWeightClass` ON `OpencartProduct`.`weight_class_id` = (
        `OpencartWeightClass`.`weight_class_id`
      ) 
      LEFT JOIN `product_option_value` `OpencartProductOptionValues` ON `OpencartProductOptionValues`.`product_option_value_id` = (
        `OrderOptions`.`product_option_value_id`
      ) 
    WHERE 
      `OrderOptions`.`order_id` = 123
    
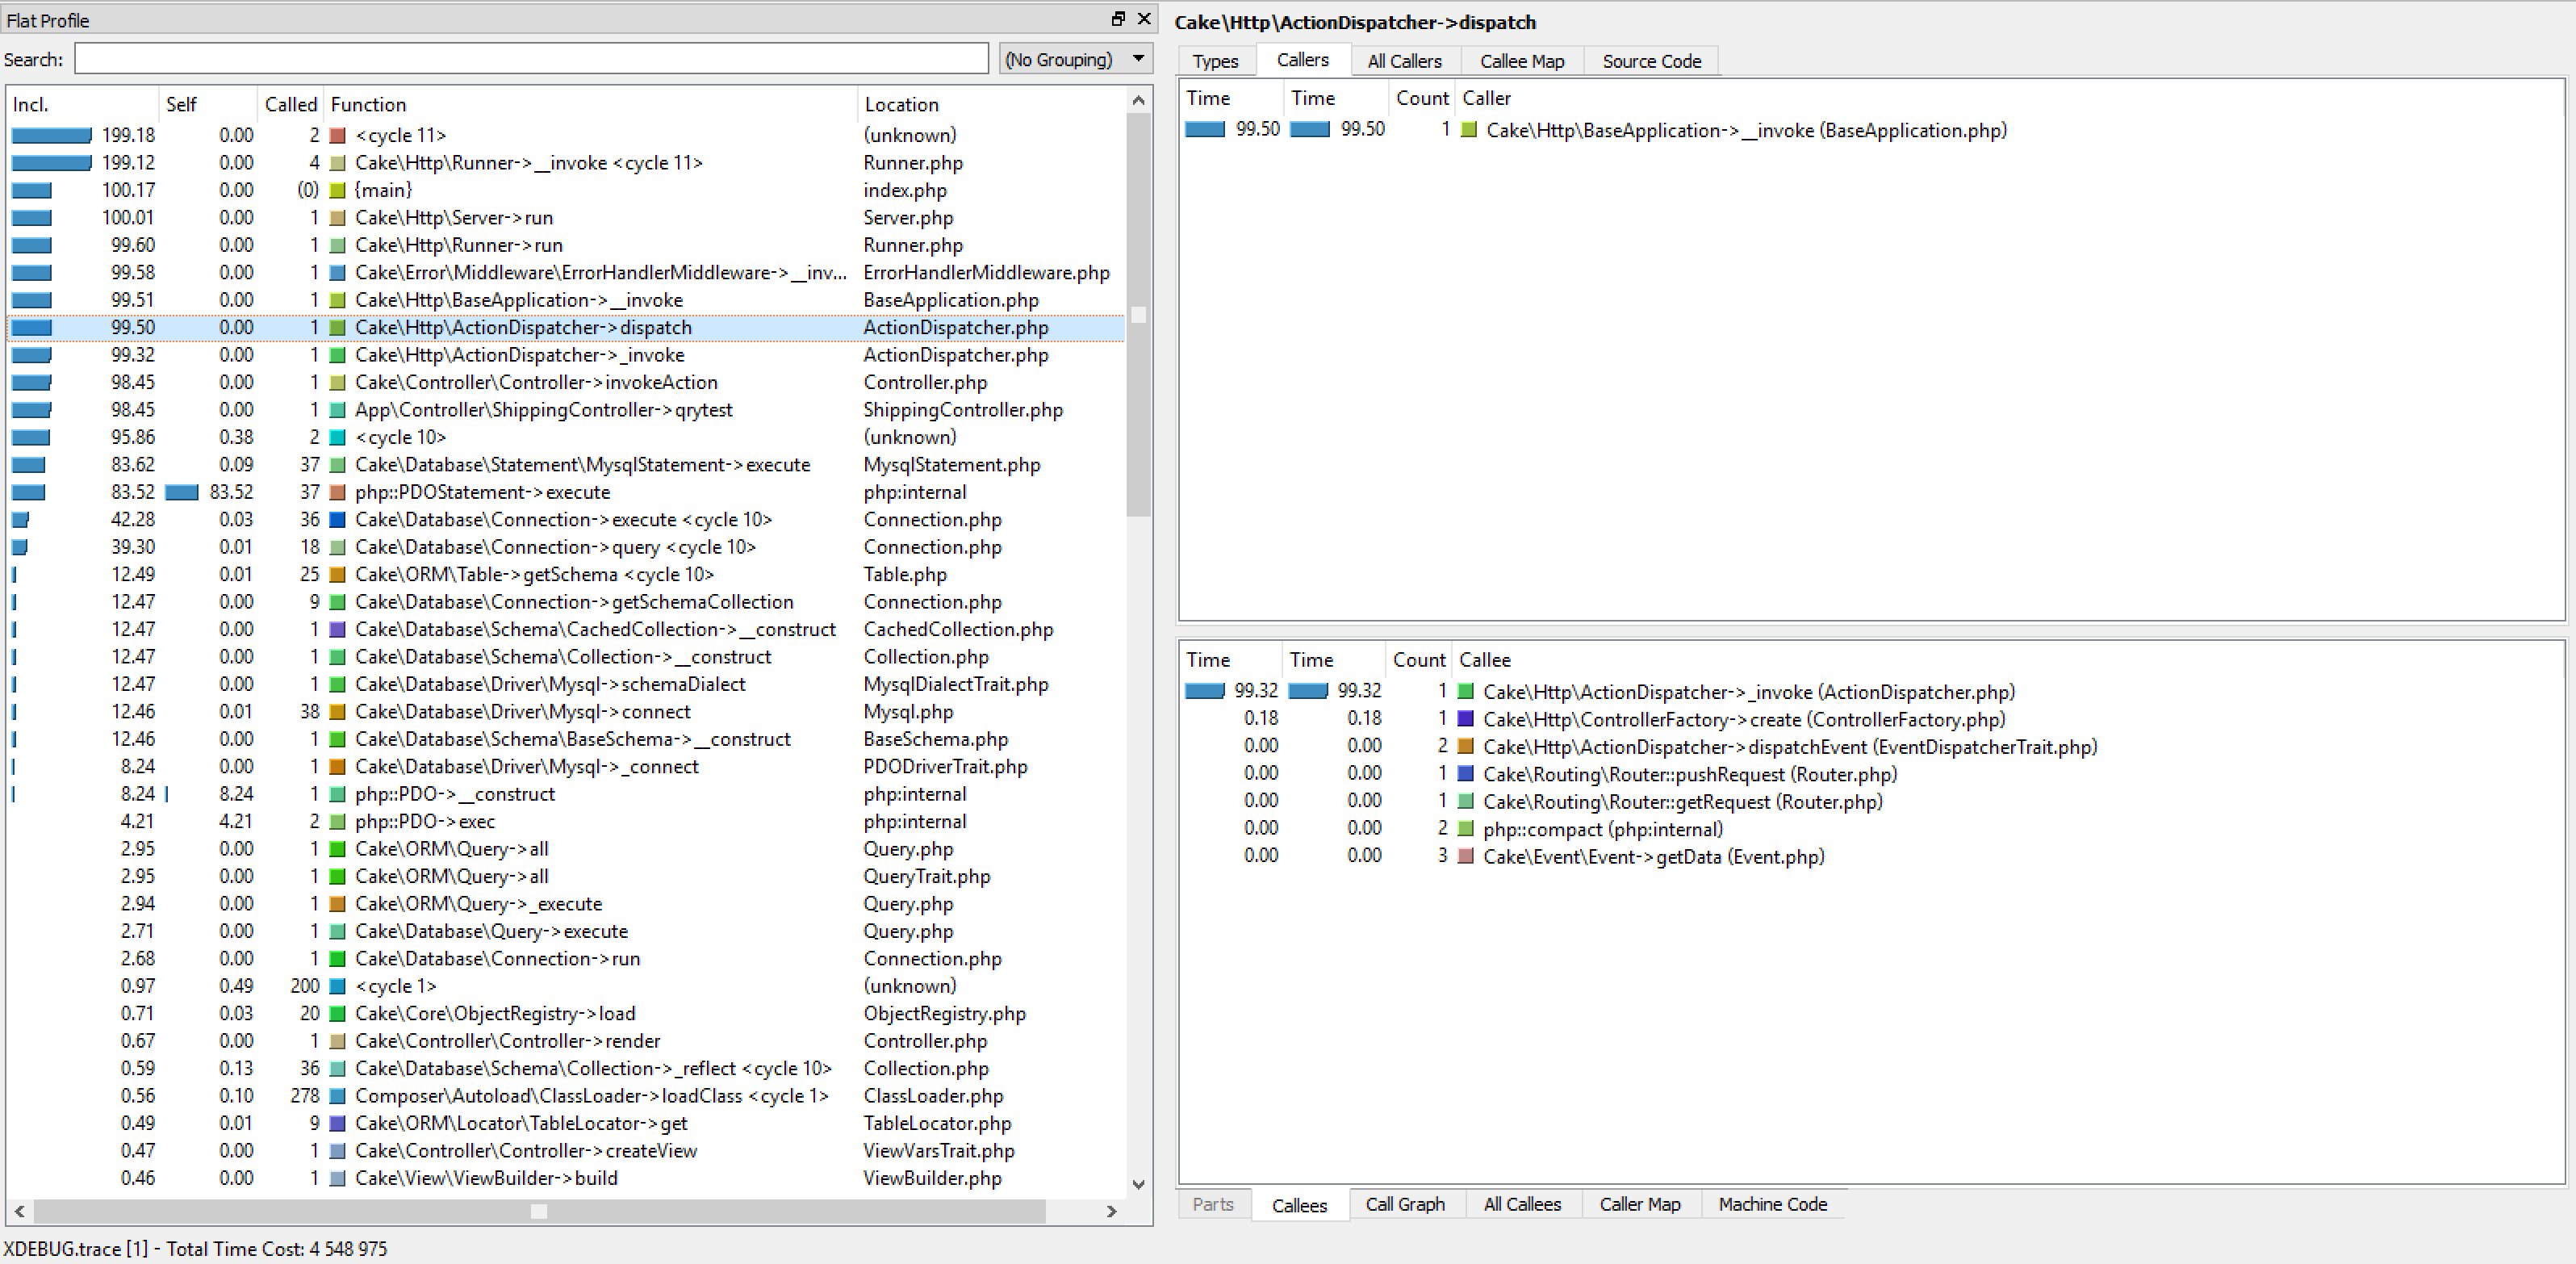
  • Here's the XDebug output:

    XDebug Output

Ballast answered 11/6, 2018 at 12:6 Comment(14)
Use xdebug to profile the script and figure out where exactly the slowness comes from. xdebug.org/docs/profiler Are there behaviors used or any map/reduce filters? ->all() - How many record does it fetch? Also, if you don't render anything, is it still slow? Execute the query in an unit test and just run this test case to get the time.Butterfingers
Also check your entities you're using for virtual fields and getters/setters that contain "complex" operations? Try to disable hydration. $query->enableHydration(false);Butterfingers
You seem to have debug turned on so the majority of the extra time might be for queries done to fetch the table schema metadata for the contained models. Try with debug off and ORM cache warmed up. The difference in page load times for the 2 cases should be considerably lesser.Taneshatang
can you should the generated queries?Unpile
@Taneshatang doesn't debugKit show just one query?Vyborg
@burzum disabling hydration did not make any difference; got the xdebug trace but can't see any bottlenecks. updated the question with more info. thank you for the suggestions!Semilunar
@Taneshatang Tried disabling the debug mode. Went to the app config and explicitly set debug to false. The toolbar was gone, but performance-wise this did not make any difference I'm afraidSemilunar
@JoséLorenzo please see the question updatedSemilunar
As you can see, most of the time is spent in PDOStatement->execute, so check out the details for that function to get an idea on which callers are responsible.Inconsequential
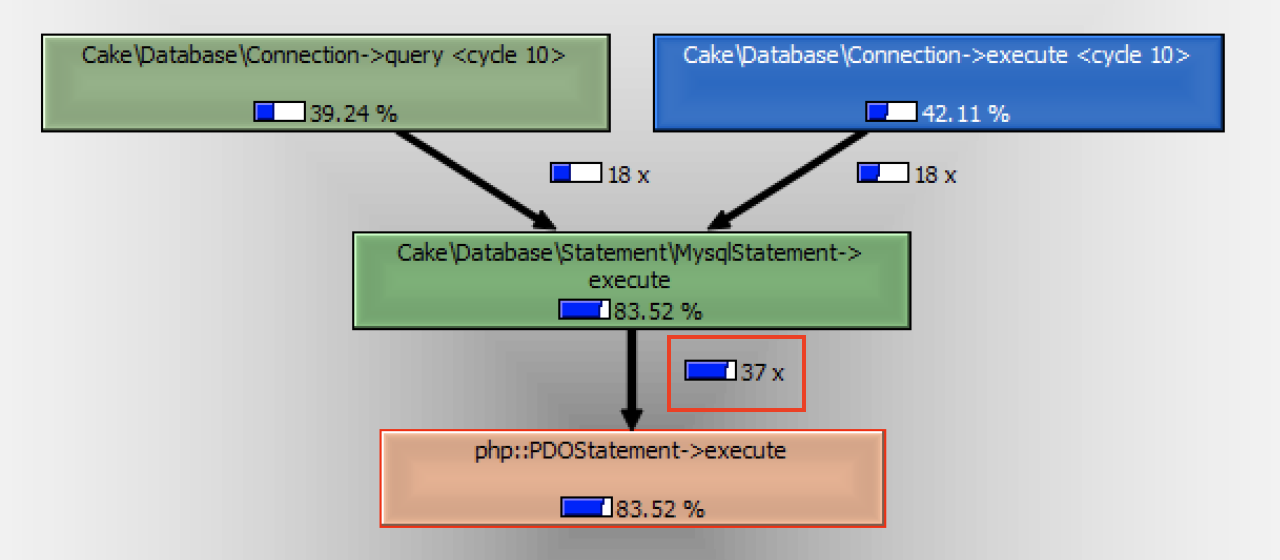
@Inconsequential I looked there (i.imgur.com/Na2iSxo.png), but all it seems to be telling me is that it has one way or another spent a lot of time on a MySQL query, which when I execute directly, only takes ~100ms. It could be that I'm missing somethingSemilunar
as ADMad wrote it seems that the time comes for queries performed to get the models' table schema. Maybe I'm wrong but I used to remember that those queries were shown in debugKit panel but now i did some tests and I don't see them any more. So you see one query where in fact there are many more. Anyway turning debug off should improve the performance since the queries are no more executed. Maybe you changed manually cache duration?Vyborg
How many records are returned by that query?Unpile
Your profiling image says that PDO::execute() was called 87 times, can you find out which of the 87 times is the slowest, why is it called so many times?Unpile
@JoséLorenzo the query returns just one record, it gets the entry by a unique primary keySemilunar
G
0

I work with larger enterprise projects and the frontend is CakePHP but when you start a discussion about performance over a framework for rapidly development you are placing a demand that this kind of framework does not handle by theyself.

Make use of CakePHP when it is appropriate to, for example show registries from a Table.

When I get into larger datasets like you, I made use of database resources to solve their problems of performance, this way I donnot demand from CakePHP performance expectations.

Using EXPLAIN you can setup the appropriate INDEX for a QUERY, when this is optimized enough setup a view simple like:

CREATE VIEW %VIEW-NAME% AS %QUERY%

If using views is not enough, for example if views still have larger datasets, start working with STORED PROCEDURES, this is an excelent way to work because you can make part of your program run inside the database, and again you use CakePHP only to show this data.

Gaga answered 21/6, 2018 at 20:3 Comment(4)
Thank you for your input and the overall helpful guidance, however, you're mainly talking about optimising MySQL, while in our case the database response speed is fast already - with or without contain, it's around 100 ms either way. Also I forgot to mention this isn't a large or a high-load application, it's an internal tool a few people will use rarely, so I don't expect performance, I just need it to not take 30 seconds to respondSemilunar
Ok, in that case I think the main problem is the way that CakePHP handle the Pagination, try to implement your own component using SQL_CALC_FOUND_ROWS from MySQL, in this way you only needs one SELECT to provision pagination, see more details here: #187088Gaga
I appreciate you trying to help, but the query here retrieves an entry by a unique primary key, where does the pagination come from? I'd much rather have it disabledSemilunar
using SQL_CALC_FOUND_ROWS useful when you do a simple single query. No where or else. Because then it may slower than count.Berneicebernelle
H
0

The query in the question is not the problem

Consider these details, extracted from the question:

the controller take almost 5 seconds

Sql Log: 1 / 99 ms

xdebug shows 37 queries

That shows 37 queries, not one.

Together this indicates: the time is not coming from the query in the question

Running the query from the question in isolation directly against the db like so:

$results = $connection
    ->execute('raw sql from the question')
    ->fetchAll('assoc');

Should confirm this if there is still some doubt, but there really is no reason to distrust the sql time debug kit is reporting (DebugKit is reporting the time the query says it took which is literally the time it took to execute the query) - any discrepancy there to actual DB time should be insignificant.


Where is the time going?

It's not possible to say with certainty what the problem is but there's a significant hint in the debug kit panel:

debug kit panel showing processing time between cache operations

Each of these red lines is exactly the same length - that looks like 10 cache read-through operations (I haven't included the calls from the second screenshot linked in the question), each of which is taking approximately half a second to populated the cache - that account for the controller action timer.

It's implied that these cache operations are probably responsible for the offending query/queries, using a connection that debug kit is not monitoring since they do not show up in the DebugKit query panel.

Conclusion: The cache population logic is the proximate cause of the lost time and where to focus attention.

Hom answered 1/10, 2022 at 12:44 Comment(1)
I realize this is an old question - perhaps some 20/20 hindsight can shed some light on what the OPs actual problem was :).Hom

© 2022 - 2024 — McMap. All rights reserved.