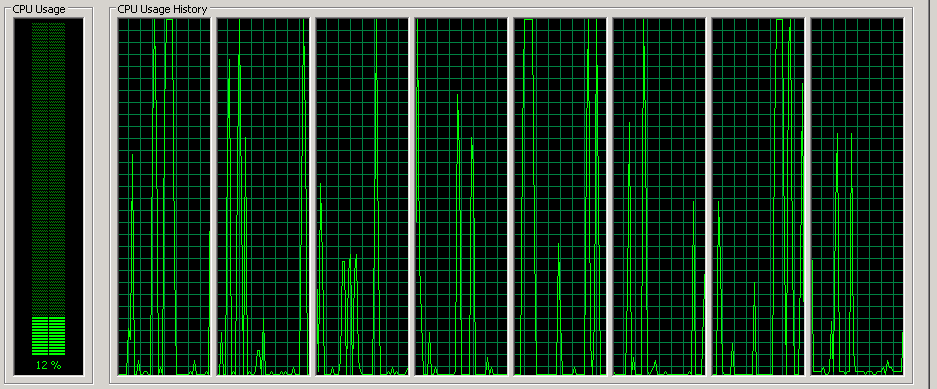
Something very strange started happening on our production servers a day or two ago regarding a WCF Service we run there: it seems that something started rate limiting the process in question's CPU cycles to the amount of CPU cycles that would be available on one core, even though the load is spread across all cores (the process is not burning one core to 100% usage)
The Service is mostly just a CRUD (create, read, update, delete) service, with the exception of a few long running (can take up to 20 minutes) service calls that exist there. These long running service calls kicks of a simple Thread and returns void so not to make the Client application wait, or hold up the WCF connection:
// WCF Service Side
[OperationBehavior]
public void StartLongRunningProcess()
{
    Thread workerThread = new Thread(DoWork);
    workerThread.Start();
}

private void DoWork()
{
    // Call SQL Stored proc
    // Write the 100k+ records to new excel spreadsheet
    // return (which kills off this thread)
}
Before the above call is kicked off, the service seems to respond as it should, Fetching data to display on the front-end quickly.
When you kick off the long running process, and the CPU usage goes to 100 / CPUCores, the front-end response gets slower and slower, and eventually wont accept any more WCF connections after a few minutes.
What I think is happening, is the long running process is using all the CPU cycles the OS is allowing, because something is rate limiting it, and WCF can't get a chance to accept the incoming connection, never mind execute the request.
At some point I started wondering if the Cluster our virtual servers run on is somehow doing this, but then we managed to reproduce this on our development machines with the client communicating to the service using the loopback address, so the hardware firewalls are not interfering with the network traffic either.
While testing this inside of VisualStudio, i managed to start 4 of these long running processes and with the debugger confirmed that all 4 are executing simultaneously, in different threads (by checking Thread.CurrentThread.ManagedThreadId), but still only using 100 / CPUCores worth of CPU cycles in total.
On the production server, it doesn't go over 25% CPU usage (4 cores), when we doubled the CPU cores to 8, it doesn't go over 12.5% CPU usage.
Our development machines have 8 cores, and also wont go over 12.5% CPU usage.
Other things worth mentioning about the service
- Its a Windows Service
- Its running inside of a TopShelf host
- The problem didn't start after a deployment (of our service anyway)
- Production server is running Windows Server 2008 R2 Datacenter
- Dev Machines are running Windows 7 Enterprise
Things that we have checked, double checked, and tried:
- Changing the process' priority up to High from Normal
- Checked that the processor affinity for the process is not limiting to a specific core
- The [ServiceBehavior] Attribute is set to ConcurrencyMode = ConcurrencyMode.Multiple
- Incoming WCF Service calls are executing on different threads
- Remove TopShelf from the equation hosting the WCF service in just a console application
- Set the WCF Service throttling values: <serviceThrottling maxConcurrentCalls="1000" maxConcurrentInstances="1000" maxConcurrentSessions="1000" />
Any ideas on what could be causing this?


ThreadPool? It will use the threads internally and more wisely than your team. – ThisbeeContextBoundObjectand/or used theSynchronizationAttributeanywhere? – PatinoDoWork()? Are there any resources shared between different threads? Any locking mechanisms? Have you profiled your service? Do most waits happen all around theThreadcode or in certain places? – Menides