I'm trying to build simple spectrum analyser using AudioKit library for iOS:
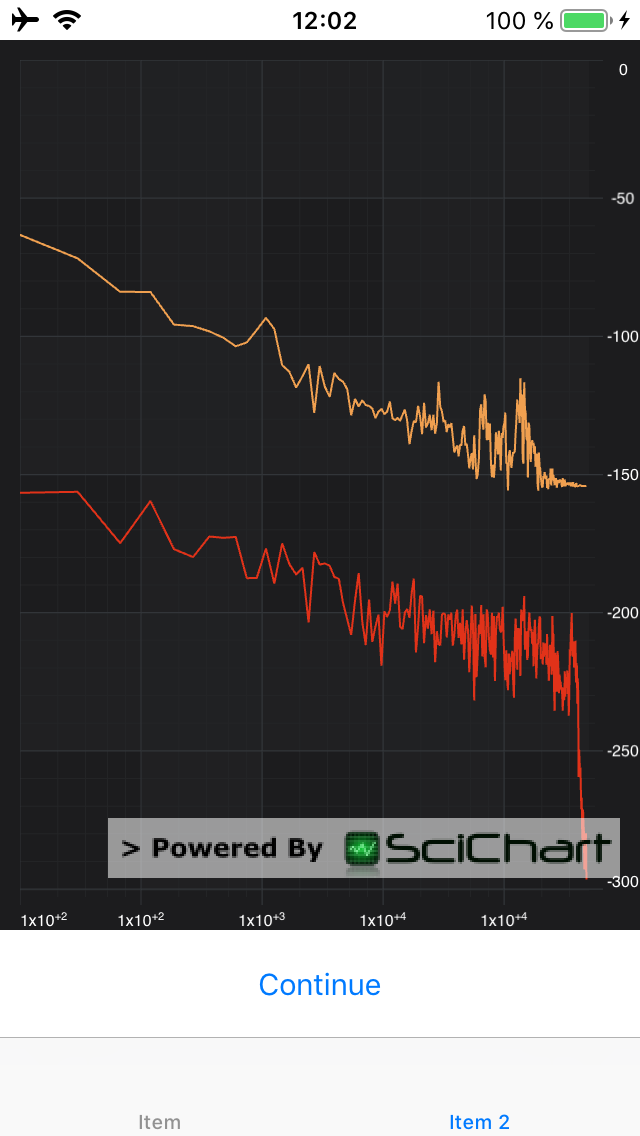
Yellow line is max, red is current - changes 10 times per second.
The problem is, that amplitude values for first few frequency points are too high, that i think is wrong.
The code (i removed parts, that not relevant to AudioKit):
AppDelegate init:
mic = AKMicrophone()

fftTap = AKFFTTap.init(mic!)
tracker = AKFrequencyTracker.init(mic)
let silence = AKBooster(tracker, gain: 0)

AudioKit.output = silence
try! AudioKit.start()
ViewController:
let micSampleRate = 44100

var tracker: AKFrequencyTracker!
var fftTap: AKFFTTap?

var maxValues = [Double](repeating: -400, count: 255)

let timeInterval = 0.1

var isPaused = true

let FFT_SIZE = 510

override func viewDidLoad() {
    super.viewDidLoad()

    tracker = (UIApplication.shared.delegate as! AppDelegate).tracker
    fftTap = (UIApplication.shared.delegate as! AppDelegate).fftTap

    let freqPreparedValue =  self.micSampleRate * 0.5 / self.FFT_SIZE

    Timer.scheduledTimer(withTimeInterval: timeInterval, repeats: true) { [unowned self] (timer) in
        if (!self.isPaused) {

            for i in stride(from: 0, to: self.FFT_SIZE - 2, by: 2) {

                let re = self.fftTap!.fftData[i]
                let im = self.fftTap!.fftData[i + 1]
                let normBinMag = 2.0 * sqrt(re * re + im * im)/self.FFT_SIZE
                //let freq = self.micSampleRate * 0.5 * i / self.FFT_SIZE
                let freq = freqPreparedValue * i
                let amplitude = 20.0 * log10(normBinMag)

                let i2 = i / 2
                if (self.maxValues[i2] < amplitude) {
                    self.maxValues[i2] = amplitude
                }

                //to understand, what is X and Y on image
                tickDataSeries.appendX(SCIGeneric(freq), y: SCIGeneric(amplitude))
                tickMaxDataSeries.appendX(SCIGeneric(freq), y: SCIGeneric(self.maxValues[i2]))

                print("bin: \(i/2) \t freq: \(freq)\t ampl.: \(amplitude)\t maxVal: \(self.maxValues[i2])\t re: \(re)\t im: \(im)" )
            }
        }
    }
}
Part of the output (not any real sounds, mostly silence around microphone):
bin: 0   freq: 0.0   ampl.: -118.073654770687    maxVal: -110.92564348456614     re: 3.5231216315878555e-05  im: 0.0003163595392834395
bin: 1   freq: 86.47058823529412     ampl.: -133.15079565501773  maxVal: -132.1323399190405  re: 5.5011274525895715e-05  im: 1.1023327715520281e-05
bin: 2   freq: 172.94117647058823    ampl.: -156.47641201587314  maxVal: -144.73820841794645     re: 3.040101546503138e-06   im: 2.3225734366860706e-06
bin: 3   freq: 259.4117647058823     ampl.: -166.16880958269164  maxVal: -152.1284594880522  re: 4.182010684417037e-07   im: 1.1816056257885066e-06
bin: 4   freq: 345.88235294117646    ampl.: -160.81829961464794  maxVal: -156.8105240841191  re: 2.272412530146539e-06   im: 4.711087910891365e-07
bin: 5   freq: 432.3529411764706     ampl.: -172.891584678714    maxVal: -162.2467662380227  re: 5.55981898742175e-07    im: 1.5817417420294078e-07
See, how fast amplitude is falling from -118 to -172 and then its bouncing around -170 - -200 values.
Isn't it wrong?

