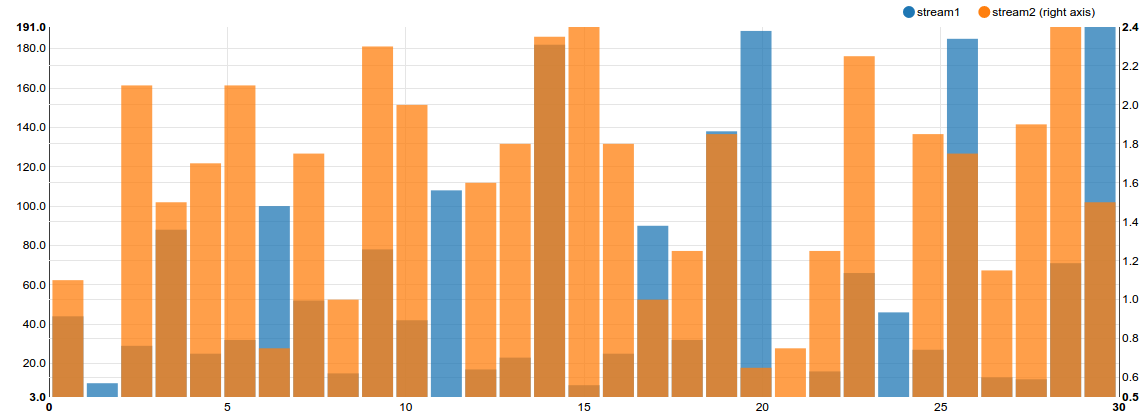
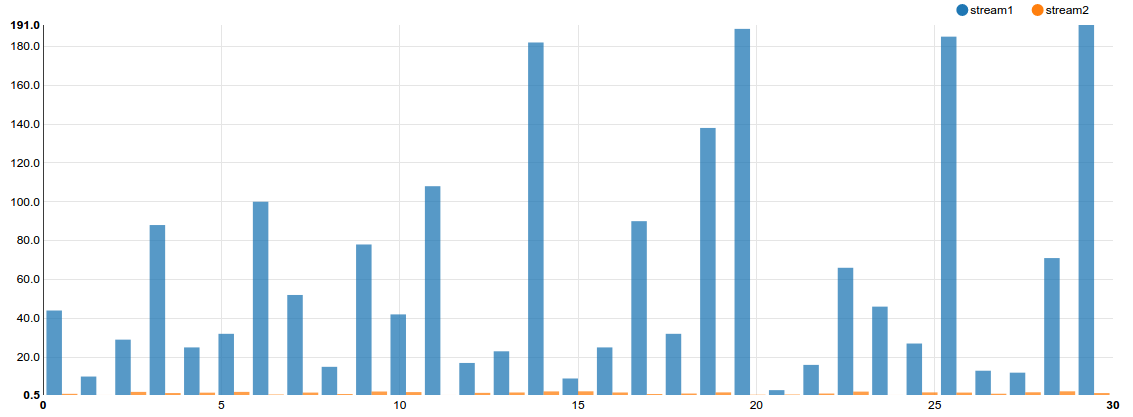
Drawing a Multiple Axis barchart using nvd3. My problem is the bars are overlapping. In the chart on y-axis is on left side and the other y-axis on right side.
<!DOCTYPE html>
<html>
<head>
    <meta charset="utf-8">
    <link href="https://cdnjs.cloudflare.com/ajax/libs/nvd3/1.8.3/nv.d3.css" rel="stylesheet" type="text/css">
    <script src="https://cdnjs.cloudflare.com/ajax/libs/d3/3.5.2/d3.min.js" charset="utf-8"></script>
    <script src="https://cdnjs.cloudflare.com/ajax/libs/nvd3/1.8.3/nv.d3.js"></script>
    <style>
        text {
            font: 12px sans-serif;
        }
        svg {
            display: block;
        }
        html, body, #chart1, svg {
            margin: 0px;
            padding: 0px;
            height: 100%;
            width: 100%;
        }
    </style>
</head>
<body class='with-3d-shadow with-transitions'>

<div id="chart1" >
    <svg> </svg>
</div>

<script>

    // var testdata = stream_layers(9,10+Math.random()*100,.1).map(function(data, i) {
    //     return {
    //         key: 'Stream' + i,
    //         values: data.map(function(a){a.y = a.y * (i <= 100 ? 100 : 1); return a})
    //     };
    // });
     var testdata=[{"key":"stream1", "values": [
    {
      "x": 0,
      "y": 44
    },
    {
      "x": 1,
      "y": 10
    },
    {
      "x": 2,
      "y": 29
    },
    {
      "x": 3,
      "y": 88
    },
    {
      "x": 4,
      "y": 25
    },
    {
      "x": 5,
      "y": 32
    },
    {
      "x": 6,
      "y": 100
    },
    {
      "x": 7,
      "y": 52
    },
    {
      "x": 8,
      "y": 15
    },
    {
      "x": 9,
      "y": 78
    },
    {
      "x": 10,
      "y": 42
    },
    {
      "x": 11,
      "y": 108
    },
    {
      "x": 12,
      "y": 17
    },
    {
      "x": 13,
      "y": 23
    },
    {
      "x": 14,
      "y": 182
    },
    {
      "x": 15,
      "y": 9
    },
    {
      "x": 16,
      "y": 25
    },
    {
      "x": 17,
      "y": 90
    },
    {
      "x": 18,
      "y": 32
    },
    {
      "x": 19,
      "y": 138
    },
    {
      "x": 20,
      "y": 189
    },
    {
      "x": 21,
      "y": 3
    },
    {
      "x": 22,
      "y": 16
    },
    {
      "x": 23,
      "y": 66
    },
    {
      "x": 24,
      "y": 46
    },
    {
      "x": 25,
      "y": 27
    },
    {
      "x": 26,
      "y": 185
    },
    {
      "x": 27,
      "y": 13
    },
    {
      "x": 28,
      "y": 12
    },
    {
      "x": 29,
      "y": 71
    },
    {
      "x": 30,
      "y": 191
    }
  ]},
  {"key":"stream2","values":[
    {
      "x": 0,
      "y": 1.1
    },
    {
      "x": 1,
      "y": 0.5
    },
    {
      "x": 2,
      "y": 2.1
    },
    {
      "x": 3,
      "y": 1.5
    },
    {
      "x": 4,
      "y": 1.7
    },
    {
      "x": 5,
      "y": 2.1
    },
    {
      "x": 6,
      "y": 0.75
    },
    {
      "x": 7,
      "y": 1.75
    },
    {
      "x": 8,
      "y": 1
    },
    {
      "x": 9,
      "y": 2.3
    },
    {
      "x": 10,
      "y": 2
    },
    {
      "x": 11,
      "y": 0.5
    },
    {
      "x": 12,
      "y": 1.6
    },
    {
      "x": 13,
      "y": 1.8
    },
    {
      "x": 14,
      "y": 2.35
    },
    {
      "x": 15,
      "y": 2.4
    },
    {
      "x": 16,
      "y": 1.8
    },
    {
      "x": 17,
      "y": 1
    },
    {
      "x": 18,
      "y": 1.25
    },
    {
      "x": 19,
      "y": 1.85
    },
    {
      "x": 20,
      "y": 0.65
    },
    {
      "x": 21,
      "y": 0.75
    },
    {
      "x": 22,
      "y": 1.25
    },
    {
      "x": 23,
      "y": 2.25
    },
    {
      "x": 24,
      "y": 0.5
    },
    {
      "x": 25,
      "y": 1.85
    },
    {
      "x": 26,
      "y": 1.75
    },
    {
      "x": 27,
      "y": 1.15
    },
    {
      "x": 28,
      "y": 1.9
    },
    {
      "x": 29,
      "y": 2.4
    },
    {
      "x": 30,
      "y": 1.5
    }
  ]}];
    testdata[0].type = "bar";
    testdata[0].yAxis = 1;
    testdata[1].type = "bar";
    testdata[1].yAxis = 2;
    console.log(testdata);

    nv.addGraph(function() {
        var chart = nv.models.multiChart()
            .margin({top: 30, right: 60, bottom: 50, left: 70})
            .color(d3.scale.category10().range())
            .height(450)
            .width(1200)
            .color(d3.scale.category10().range())
            .useInteractiveGuideline(true)
            .interpolate('linear');

        chart.xAxis.tickFormat(d3.format(',f'));
        chart.yAxis1.tickFormat(d3.format(',.1f'));
        chart.yAxis2.tickFormat(d3.format(',.1f'));

        d3.select('#chart1 svg')
            .datum(testdata)
            .transition().duration(500).call(chart);

        return chart;
    });

</script>
</body>
</html>
A Plunkr setup embeded for this can be found here.
Two set of data to draw the multi graph But the bars are overlapping. My Out put screen shot is here.
the only thing to do is to adjust the width and position of bars. those are selectable by the class
d3.selectAll ('.bars1Wrap .nv-groups .nv-series-0 rect')
When I switch the axis to
testdata[1].yAxis = 1;
But the problem is the ranging of the data lost. I need different range for two dataset.
I tried to adjust the width of the bars after drawing the chart
like
var g3 =  d3.selectAll ('.bars1Wrap .nv-groups .nv-series-0 rect')
                             .attr("width", function(d){ return d/2;});
But no Success... Any help appreciated.


