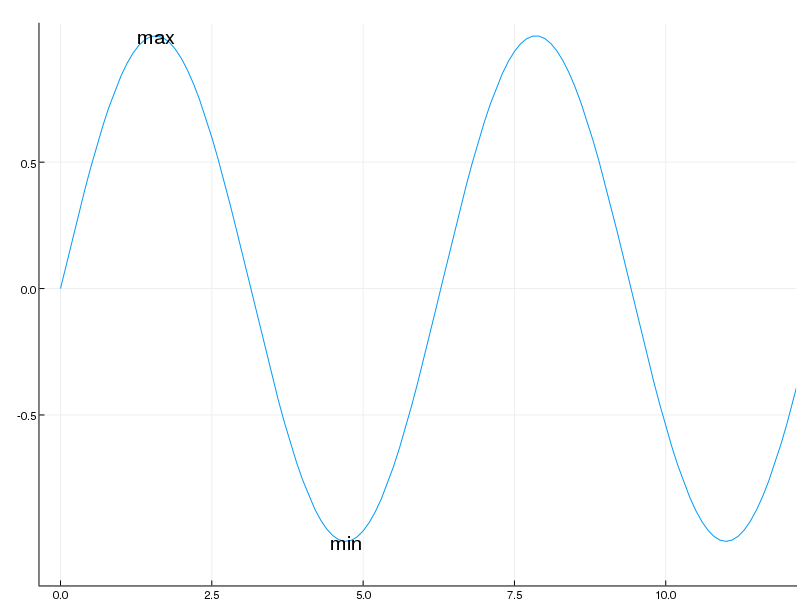
The annotation attribute in Julia Plots seems to only take tuples of x,y coordinates and a label according to the documentation. Is there any way to do this on a 3D plot? For example:
tvec=0:0.1:4*pi
plot(sin, tvec)
annotate!(pi/2,1.0,"max")
annotate!(3*pi/2,-1.0,"min")
produces
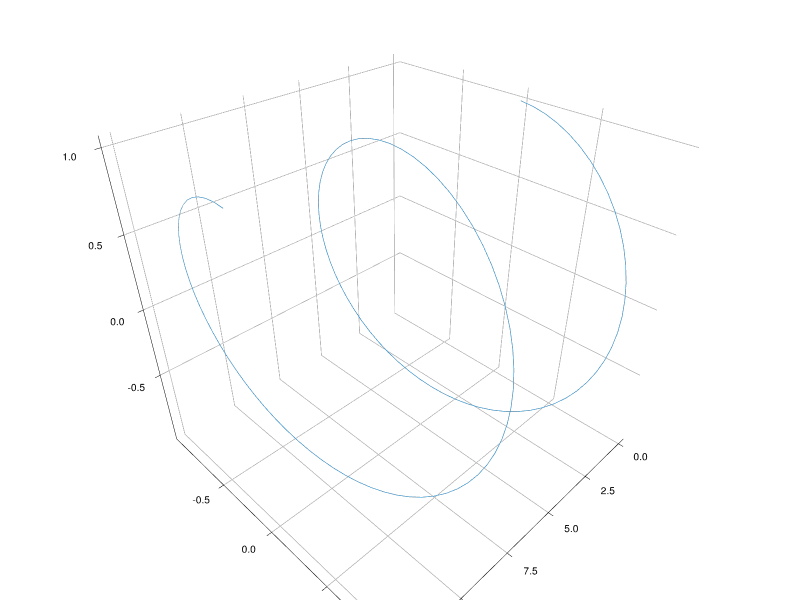
 but how do you add something to
tvec=0:0.1:4*pi
plot(tvec, sin(tvec), cos(tvec))
Using the same type of annotate! command seems to annotate onto a superimposed 2D coordinate.

