RGB values of visible spectrum
Asked Answered
F

12

72

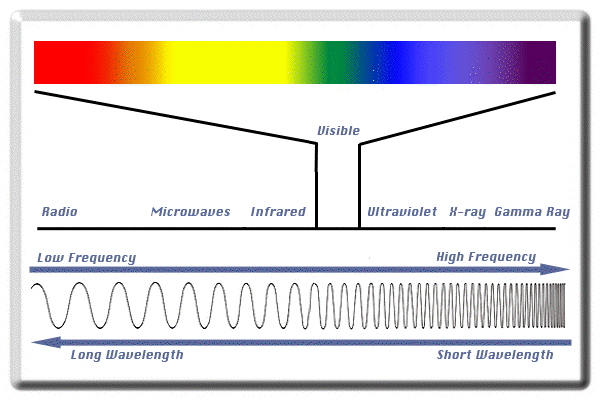
I need an algorithm or function to map each wavelength of visible range of spectrum to its equivalent RGB values. Is there any structural relation between the RGB System and wavelength of a light? like this image: alt text
(source: kms at www1.appstate.edu)

sorry if this was irrelevant :-]

Farrow answered 4/8, 2010 at 17:7 Comment(4)
This question may give you some insight. #1473014Vouvray
Spectral Colors and RGB colors have a inf-to-1 relation, so there is no unique relation. One RGB colour maps to infinitely many spectral colours.Bohemian
look here: https://mcmap.net/q/122463/-how-do-i-draw-a-rainbow-in-freeglut and yes this can be used only to wavelength -> RGB conversion not the other way around ... (wavelength has color but color is not wavelength ...)Hazy
added mine new wavelength -> RGB conversion based on real linearized spectroscopy dataHazy
E
7

There is a relationship between frequency and what is known as Hue, but for complicated reasons of perception, monitor gamut, and calibration, the best you can achieve outside of expensive lab equipment is a gross approximation.

See http://en.wikipedia.org/wiki/HSL_and_HSV for the math, and note that you'll have to come up with your best guess for the Hue ⇔ Frequency mapping. I expect this empirical mapping to be anything but linear.

Everrs answered 4/8, 2010 at 17:16 Comment(3)
the whole math for Hue -> RGB mapping is approximation (linear). Hue -> freq can be mapped as wavelength 390 to 750 nm maps to hue [0, 1]. freq = c / wavelengthIntercessor
Note my use of the word "empirical" and then try it for yourself whilst remembering that our perception is trichromat and distinctly non-linear and that monitors are a different trichromatic and are also extremely non-linear. There is an entire calibration industry built around these effects.Everrs
Hue is the angle around the white-black axis in the RGB cube. Sure there is some sort of relationship to wavelength, but it is more accidental than by design. Note that one sextant of this plane has colors that do not map to any wavelength at all.Entablature
H
59

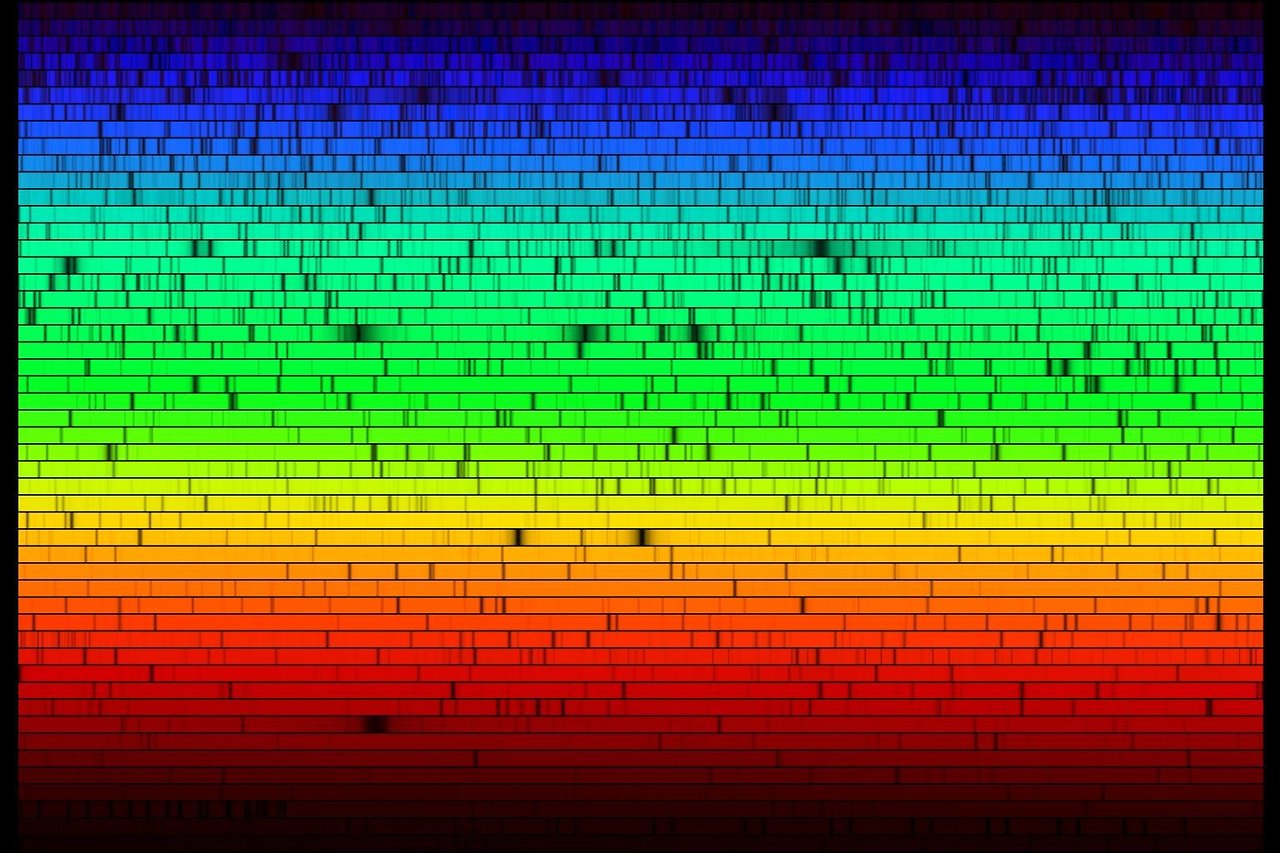
I recently found out that my spectral colors don't work properly because they were based on nonlinear and shifted data. So I did little research and data compilation and found out that most spectrum images out there are incorrect. Also, the color ranges do not match to each other, so I used from this point only linearized real spectroscopy data like this (original link now dead):

sun real linear spectra

Here is the rectified output of mine:

spectral colors

  • the first spectrum is the best rendered spectrum I found but still way off the real thing
  • the second one is linearized Spectrum of our Sun taken from Earth
  • the last one is my current color output

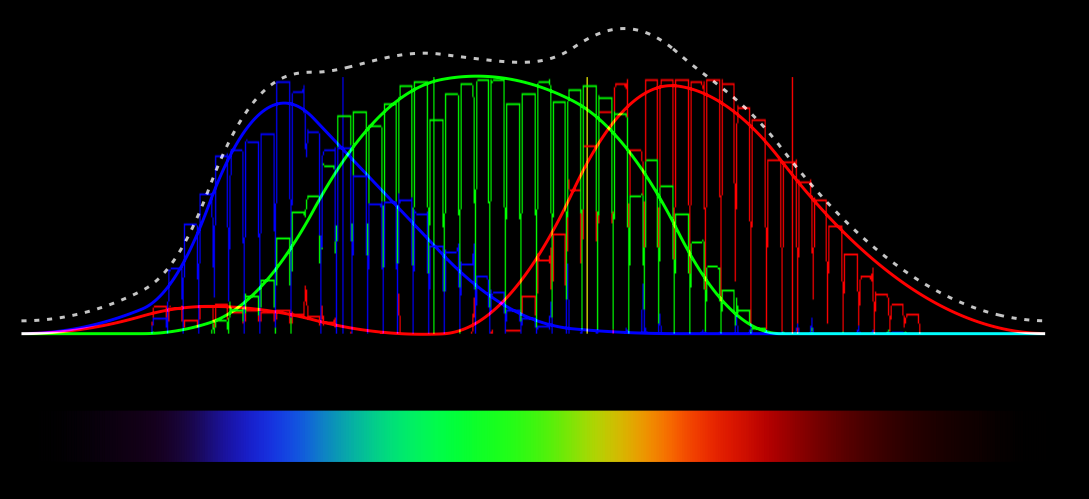
Below are the RGB graphs:

This is the merge of both graphs:

graph merge

Now the code:

void spectral_color(double &r,double &g,double &b,double l) // RGB <0,1> <- lambda l <400,700> [nm]
    {
    double t;  r=0.0; g=0.0; b=0.0;
         if ((l>=400.0)&&(l<410.0)) { t=(l-400.0)/(410.0-400.0); r=    +(0.33*t)-(0.20*t*t); }
    else if ((l>=410.0)&&(l<475.0)) { t=(l-410.0)/(475.0-410.0); r=0.14         -(0.13*t*t); }
    else if ((l>=545.0)&&(l<595.0)) { t=(l-545.0)/(595.0-545.0); r=    +(1.98*t)-(     t*t); }
    else if ((l>=595.0)&&(l<650.0)) { t=(l-595.0)/(650.0-595.0); r=0.98+(0.06*t)-(0.40*t*t); }
    else if ((l>=650.0)&&(l<700.0)) { t=(l-650.0)/(700.0-650.0); r=0.65-(0.84*t)+(0.20*t*t); }
         if ((l>=415.0)&&(l<475.0)) { t=(l-415.0)/(475.0-415.0); g=             +(0.80*t*t); }
    else if ((l>=475.0)&&(l<590.0)) { t=(l-475.0)/(590.0-475.0); g=0.8 +(0.76*t)-(0.80*t*t); }
    else if ((l>=585.0)&&(l<639.0)) { t=(l-585.0)/(639.0-585.0); g=0.84-(0.84*t)           ; }
         if ((l>=400.0)&&(l<475.0)) { t=(l-400.0)/(475.0-400.0); b=    +(2.20*t)-(1.50*t*t); }
    else if ((l>=475.0)&&(l<560.0)) { t=(l-475.0)/(560.0-475.0); b=0.7 -(     t)+(0.30*t*t); }
    }
//--------------------------------------------------------------------------

Where

  • l is the wavelength in [nm] usable valueas are l = < 400.0 , 700.0 >
  • r,g,b are returning color components in range < 0.0 , 1.0 >
Hazy answered 27/3, 2014 at 7:58 Comment(13)
@tivus no it is not an typo it should be 5.82 as it is in the code!!! otherwise the Green end of slope will overflow to negative values around 639 nm creating invalid color peak.Hazy
couldn't this code be very simplified if you use functions to approximate the curves of each color band? One function that comes to mind that might be good is 1/sqrt(x^2+1), with each band getting the appropriate changes.Scharf
@Scharf changing simple low order polynomial with 1/sqrt does not sound good to me(speed,accuracy) if you want speed or code simplicity use table + interpolation.Hazy
I ended up using a 5th degree polynomial regression on the color bands from the photo you linked to make functions for this, though I haven't implemented it yet. I am certain though, that the readability gained from using three function calls instead of a mess of ifs and elses will more than make up for the negligible slow down.Scharf
@Scharf I agree if the fit will be good enough post it and please comment me so I see it too (for mine purposes is speed not priority but the color correctness) as I wrote above this fit was done manually so more then second degree polynomial would be horrible for edit (via mouse wheel and few keys) the if's are bad for pipelines so changing them for few multiplications may be faster. Do not forget to fit the bands to that real spectrum graph (choppy bars)Hazy
Your rendering doesn't seem to have enough violet. The left end of the spectrum is mostly blue, while even a rainbow from a prism looks very violet at the short wavelengths end.Epner
@Epner A prism's refraction angle varies nonlinearly with wavelength. So you are comparing apples and oranges This spectra has linear wavelength scale (like for diffraction gratings). When I visually compare with linear Sun's Spectra with my home made Spectroscope (DVD grating + some optics and diffraction gap) then it matches (in colors and also in proportions of the interval there is a bit more red then blue/violet). But you need to take into account also the monitor you are viewing this spectra with (especially if you got gamma and RGB correction ON because those can screw this up a lot).Hazy
@Epner also if you monitor uses different wavelengths for the RGB then all is screwed for good as you would need to do reintegration to X,Y,Z curves for those different wavelengthd to make it right again ...Hazy
@Hazy even wide gamut displays don't implement whole specter. mainly because they can't. What they do is that they emit three different ranges of wavelength, it is quantized thanks to matrix function principle. Our eyes "usually" decode that similar to monotonic wavelength for one simple reason: eye sensors are just stack of filters, each sensitive to certain wavelength range. They get partially agitated , combination of which creates "color". The first work on this topic and about"fake" perception colors was written by.. Wolfgang Goethe. It is known as "color theory" used by artists.Maddie
The "like this" link in your first paragraph is dead. Does not load anymore: cfa.harvard.edu/ssp/images/SolarCCD.jpg (Not Found).Tunesmith
@SohailSi thx for noting me I added lower quality image from my archive (the original is in reverse order and 2.9MByte jpg in size which is beond imgur 2MByte limit so can not post it)Hazy
@Hazy I posted a smoother quadratic interpolation of your measured data as a follow-up answer. I just fitted that by eye, but I also tried to err on the side of making the overall RGB magnitude (dotted line) as smooth as possible, which was basically an artistic choice as I don't know much about colorimetry.Odaniel
@Odaniel it look more smooth but the error is probably bigger the real test is to compare rendered and real spectrum colors visually in the same scale. If your shape differs then the colors will be shifted from their real positions slightly as it can be seen on the comparison "rendered crap good one" vs. "real spectrum data"Hazy
O
22

To convert a wavelength into an RGB color

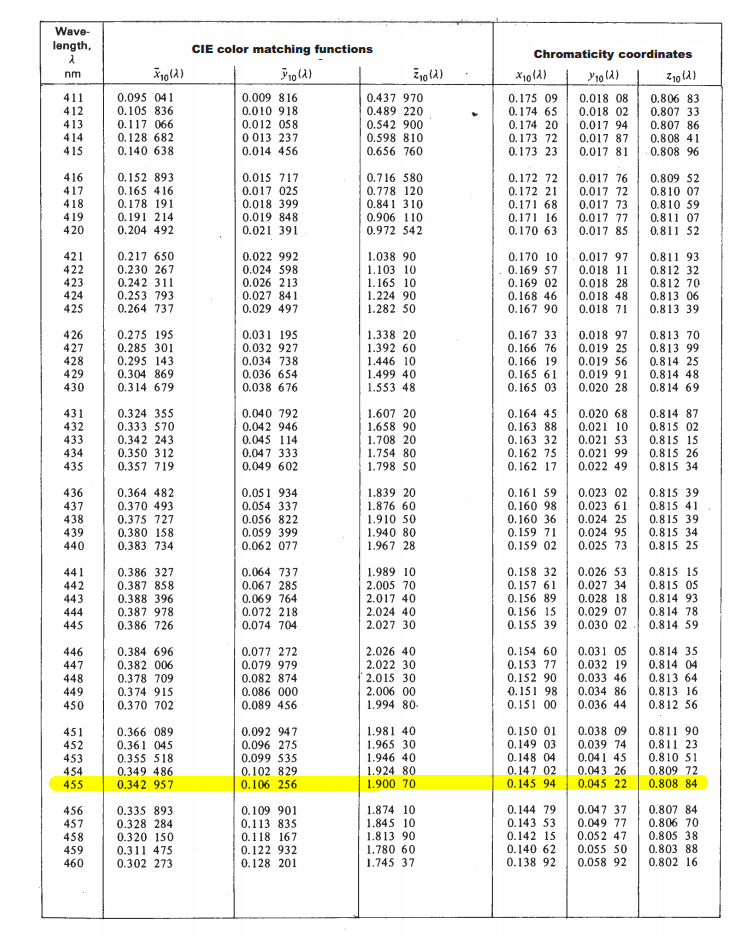
First you consult a CIE 1964 Supplementary Standard Colorimetric Observer chart (archive)

https://i.stack.imgur.com/sEeR5.jpg

and look up the CIE color matching function values for the wavelength you want.

For example, i want to get the color of 455 nm light:

enter image description here

For our desired wavelength:

╔════════════╦═══════════════════════════════╦═════════════════════════════╗
║ Wavelength ║ CIE color matching functions  ║  Chromacity coordinates     ║
║   λ nm     ║    X     │     Y    │    Z    ║    x    │    y    │    z    ║
╟────────────╫──────────┼──────────┼─────────╫─────────┼─────────┼─────────╢ 
║ 455        ║ 0.342957 │ 0.106256 │ 1.90070 ║ 0.14594 │ 0.04522 │ 0.80884 ║
╚════════════╩══════════╧══════════╧═════════╩═════════╧═════════╧═════════╝

Note: The chromacity coordinates are simply calculated from the CIE color matching functions:

x = X / (X+Y+Z)
y = Y / (X+Y+Z)
z = Z / (Z+Y+Z)

Given that:

X+Y+Z = 0.342257+0.106256+1.90070 = 2.349913

we calculate:

x = 0.342257 / 2.349913 = 0.145945
y = 0.106256 / 2.349913 = 0.045217
z = 1.900700 / 2.349913 = 0.808838

You now have your 455 nm light specified using two different color spaces:

  • XYZ: (0.342957, 0.106256, 1.900700)
  • xyz: (0.145945, 0.045217, 0.808838)

We can also add a third color space: xyY

x = x = 0.145945
y = y = 0.045217
Y = y = 0.045217

We now have the 455 nm light specified in 3 different color spaces:

  • XYZ: (0.342957, 0.106256, 1.900700)
  • xyz: (0.145945, 0.045217, 0.808838)
  • xyY: (0.145945, 0.045217, 0.045217)

So we've converted a wavelength of pure monochromatic emitted light into a XYZ color. Now we want to convert that to RGB.

How to convert XYZ into RGB?

XYZ, xyz, and xyY are absolute color spaces that describe colors using absolute physics.

Meanwhile, every practical color spaces that people use:

  • Lab
  • Luv
  • HSV
  • HSL
  • RGB

depends some whitepoint. The colors are then described as being relative to that whitepoint.

For example,

  • in RGB (255,255,255) means "white"
  • in Lab (100, 0, 0) means "white"
  • in LCH (100, 0, 309) means "white"
  • in HSL (240, 0, 100) means "white"
  • in HSV (240, 0, 100) means "white"

But there is no such color as white. How do you define white? The color of sunlight?

  • at what time of day?
  • with how much cloud cover?
  • at what latitude?
  • on Earth?

Some people use the white of their (horribly orange) incandescent bulbs to mean white. Some people use the color of their florescent lights. There is no absolute physical definition of white - white is in our brains.

So we have to pick a white

We have to pick a white. (Really you have to pick a white.) And there are plenty of whites to choose from:

I will pick a white for you. The same white that sRGB uses:

  • D65 - daylight illumination of clear summer day in northern Europe

D65 (which has a color close to 6504K, but not quite because of the Earth's atmosphere), has a color of:

  • XYZ_D65: (0.95047, 1.00000, 1.08883)

With that, you can convert your XYZ into Lab (or Luv) - a color-space equally capable of expressing all theoretical colors. And now we have a 4th color space representation of our 445 nm monochromatic emission of light:

  • XYZ: (0.342957, 0.106256, 1.900700)
  • xyz: (0.145945, 0.045217, 0.808838)
  • xyY: (0.145945, 0.045217, 0.045217)
  • Lab: (38.94259, 119.14058, -146.08508) (assuming d65)

But you want RGB

Lab (and Luv) are color spaces that are relative to some white-point. Even though you were forced to pick an arbitrary white-point, you can still represent every possible color.

RGB is not like that. With RGB:

  • not only is the color relative to some white-point
  • it is also relative to three primary colors: red, green, blue

If you specify an RGB color of (255, 0, 0), you are saying you want "just red". But there is no definition of red. There is no such thing as "red", "green", or "blue". The rainbow is continuous, and doesn't come with an arrow saying:

This is red

And again this means we have to pick three pick three primary colors. You have to pick your three primary colors to say what "red", "green", and "blue" are. And again you have many different defintions of Red,Green,Blue to choose from:

  • CIE 1931
  • ROMM RGB
  • Adobe Wide Gamut RGB
  • DCI-P3
  • NTSC (1953)
  • Apple RGB
  • sRGB
  • Japanese NTSC
  • PAL/SECAM
  • Adobe RGB 98
  • scRGB

I'll pick for you. I'll pick these three colors:

  • Red: xyY = (0.6400, 0.3300, 0.2126)
  • Green: xyY = (0.3000, 0.6000, 0.7152)
  • Blue: xyY = (0.1500, 0.0600, 0.0722)

Those were also the primaries chosen for by an international committee in 1996.

They created a standard that said everyone should use:

  • Whitepoint: D65 daylight
  • Red: (0.6400, 0.3300, 0.2126)
  • Green: (0.3000, 0.6000, 0.7152)
  • Blue: (0.1500, 0.0600, 0.0722)

And they called that standard sRGB.

The final push

Now that we have chosen our

  • white-point
  • three primaries

we can now convert you XYZ color into RGB:

  • RGB = (1.47450, -178.21694, 345.59392)

Unfortunately there are some problems with that RGB value:

  • your monitor cannot display negative green (-178.21694); that means it's a color outside what your monitor can display.
  • your monitor cannot display more blue than 255 (345.59392); the monitor only only be as blue as the blue is - it can't get any bluer. That means it's a color outside what your monitor can display.

So we have to round:

  • XYZ: (0.342957, 0.106256, 1.900700)
  • xyz: (0.145945, 0.045217, 0.808838)
  • xyY: (0.145945, 0.045217, 0.045217)
  • Lab: (38.94259, 119.14058, -146.08508) (d65)
  • RGB: (1, 0, 255) (sRGB)

And now we have the closest approximation sRGB of wavelength 455 nm of light:

enter image description here

Oneman answered 1/8, 2018 at 17:27 Comment(10)
Better to suggest the 1931 CIE 2° standard observer chart, as the governs the majority of RGB cases. See also, Colour-Science.org for the CMFS and a plethora of other useful functions.Cralg
You pick a reasonable white point, but the problem is that many monitors have default white point that is very far from D65 (and thus are far from being sRGB-compliant by default). I've been using such monitors that have yellowish whites, closer to D50 (and adjusting RGB maxima for calibration reduced maximum brightness threefold there), as well as those with 11 000 K whites.Epner
BTW, you've forgotten about gamma correction. sRGB specifies a nonlinearity that can be modelled as a gamma of 2.2, so your final RGB value should be raised to the power of 1/2.2 before displaying it on the screen.Epner
@Epner I did not Also the idea of 2.2 needs to die - we've been in sRGB for over 20 years now.Oneman
Not sure what you meant by this link. My point is that if you display #00007f and #0000ff, you'll not get the former color having half the luminance of the latter, instead something closer to 22% of the latter's luminance. And I'm also not sure what exactly idea you want to die. If you mean that piecewise linear-and-2.4 pedantry, then its difference from 2.2 is pretty negligible compared to the imperfection of gamma curves of real-world monitors.Epner
@Epner The pedantry was you said i forgot about the sRGB transfer function; i did not. And i want to remind everyone not to use 2.2 - when they can just as easily use the correct function.Oneman
Almost a year later I've learned to appreciate your insistence on the correct sRGB transfer function. I wasn't smart enough before to take into account the relative error of the 2.2 approximation, which appears quite significant at low RGB values and sometimes noticeable even at high values. Although real monitors deviate from sRGB, calibration should fix the transfer function to the piecewise version, rather than to the power-of-2.2 one.Epner
@Epner Nice to hear that. The sRGB transfer function really only is important if you're dealing with sRGB - you're free to use the simply gamma of 2.2 if you're not following the sRGB rules. But if you're dealing with sRGB images, you want to follow the sRGB rules. And since the entire Internet, all PCs, all browsers, and all digital cameras have settled on sRGB: it's good to just use the right transfer function - especially when the changes needed to support it are so trivial.Oneman
Is "Y" in "xyY" supposed to be equal to "y" in "xyz", or is it supposed to be the same as "Y" in "XYZ"? Since you appear to have it be the same as "y".Overweary
Possible type here: z = Z / (Z+Y+Z), denominator should be (X+Y+Z).Oberstone
I
15

Partial "Approximate RGB values for Visible Wavelengths"

Credit: Dan Bruton - Color Science

Original FORTRAN code @ (http://www.physics.sfasu.edu/astro/color/spectra.html)

Will return smooth(continuous) spectrum, heavy on the red side.

w - wavelength, R, G and B - color components

Ignoring gamma and intensity simple leaves:

if w >= 380 and w < 440:
    R = -(w - 440.) / (440. - 380.)
    G = 0.0
    B = 1.0
elif w >= 440 and w < 490:
    R = 0.0
    G = (w - 440.) / (490. - 440.)
    B = 1.0
elif w >= 490 and w < 510:
    R = 0.0
    G = 1.0
    B = -(w - 510.) / (510. - 490.)
elif w >= 510 and w < 580:
    R = (w - 510.) / (580. - 510.)
    G = 1.0
    B = 0.0
elif w >= 580 and w < 645:
    R = 1.0
    G = -(w - 645.) / (645. - 580.)
    B = 0.0
elif w >= 645 and w <= 780:
    R = 1.0
    G = 0.0
    B = 0.0
else:
    R = 0.0
    G = 0.0
    B = 0.0
Intercessor answered 4/8, 2010 at 17:10 Comment(12)
This would give 6 discrete RGB values. Anything for the in-between colours?Brackish
@Brackish no, it is gradient. w is inside the expressions, so they are f(w)Intercessor
Aren't the R=-(w - 440.) / (440. - 350.) bits for the in-between values? R,G,B are floating-point here, not ints.Vibrations
What's the source of the algorithm - your own from frequency tables for some colours or is this a standard computation?Vibrations
@FrustratedWithFormsDesigner: there is not just five discrete values. (w stands for the wavelenght.) it sounds to work. i'll try it.Farrow
This answer false for reasons noted in my answer.Everrs
@Everrs My answer gives acceptable approximation. it is almost a conversion from hue (wavelength) to RBG. what is wrong? author needs formula firstIntercessor
@Vibrations it is not mine, but i think it corresponds well with en.wikipedia.org/wiki/File:Computer_color_spectrum.svg (see RGB decomposition below the spectrum)Intercessor
The biggest error is in the completely arbitrary choices of the brackets for w. As I noted, one can only make gross approximations, but this example implies 3 significant digits of precision thus giving the appearance of accuracy where there is none.Everrs
I assume that's wavelength in nm, nanometers (not nautical miles). This appears to be a fairly simple (i.e. "crude" for many purposes) approximation for light (not pigment) that I believe could be compared to using only the Hue and ignoring the Saturation and Level / Value in a HSV/HSL colorspace, that may or may not be suitable depending on application (which the OP didn't specify).Paganism
@Everrs depends on application. if you write scientific app then yes it is bad, but if you want to create rolling rainbow it is fine.Intercessor
@Paganism yes yes yes, still hsl/hsv -> rgb breaks function into 6 regions, this is not very precise, neither is my function.Intercessor
E
7

There is a relationship between frequency and what is known as Hue, but for complicated reasons of perception, monitor gamut, and calibration, the best you can achieve outside of expensive lab equipment is a gross approximation.

See http://en.wikipedia.org/wiki/HSL_and_HSV for the math, and note that you'll have to come up with your best guess for the Hue ⇔ Frequency mapping. I expect this empirical mapping to be anything but linear.

Everrs answered 4/8, 2010 at 17:16 Comment(3)
the whole math for Hue -> RGB mapping is approximation (linear). Hue -> freq can be mapped as wavelength 390 to 750 nm maps to hue [0, 1]. freq = c / wavelengthIntercessor
Note my use of the word "empirical" and then try it for yourself whilst remembering that our perception is trichromat and distinctly non-linear and that monitors are a different trichromatic and are also extremely non-linear. There is an entire calibration industry built around these effects.Everrs
Hue is the angle around the white-black axis in the RGB cube. Sure there is some sort of relationship to wavelength, but it is more accidental than by design. Note that one sextant of this plane has colors that do not map to any wavelength at all.Entablature
T
6

I think the answers fail to address a problem with the actual question.

RGB values are generally derived from the XYZ color space which is the combination of a standard human observer function, an illuminate and the relative power of the sample at each wavelength over the range of ~360-830.

I'm not sure of what you are trying to achieve here but it would be possible to calculate a relatively "accurate" RGB value for a sample where each discrete band of the spectrum @ say 10nm was fully saturated. The transform looks like this Spectrum ->XYZ->RGB. Check out Bruce Lindbloom's site for the math. From the XYZ you can also easily calculate hue, chroma or colorimetric values such as L*a*b*.

Treponema answered 25/3, 2011 at 6:42 Comment(0)
C
6

If you want an exact match then the only solution is to perform a convolution of the x,y,z color matching functions with your spectral values so you finally get a (device-independent) XYZ color representation that you can later convert into (device-dependent) RGB.

This is described here: http://www.cs.rit.edu/~ncs/color/t_spectr.html

You can find the x,y,z color matching function for convolution here: http://cvrl.ioo.ucl.ac.uk/cmfs.htm

Cageling answered 30/11, 2012 at 14:7 Comment(0)
T
5

This is most of what color profiles deal with. Basically, for a given device (scanner, camera, monitor, printer, etc.) a color profile tells what actual colors of light will be produced by a specific set of inputs.

Also note that for most real devices, you only deal with a few discrete wavelengths of light, and intermediate colors are produced not by producing that wavelength directly, but by mixing varying amounts of the two neighboring wavelengths that are available. Given that we perceive color in the same way, that's not really a problem, but depending on why you care, it may be worth knowing anyway.

Without a color profile (or equivalent information) you lack the information necessary to map RGB value to colors. An RGB value of pure red will normally map to the reddest color that device is capable of producing/sensing (and likewise, pure blue to the bluest color, etc.) -- but that reddest or bluest can and will vary (widely) based on the device (and in some cases not just the device itself either--e.g., switching inks in a printer can change the characteristics).

Taligrade answered 4/8, 2010 at 18:15 Comment(0)
M
2

Patapom has it almost right: for each wavelength you calculate the CIE XYZ values, then convert those to (say) sRGB using standard formulas (if you're lucky you'll find code you can just use to do this conversion). So the key step is getting the XYZ values. Fortunately, for single-wavelength light this is easy: the XYZ color matching functions are simply tables listing the XYZ values for a given wavelength. So just look it up. If you had light with a more complicated spectrum, maybe a black body, then you'd have to average the XYZ responses times the amount of each wavelength in the light.

Magically answered 10/5, 2013 at 7:44 Comment(0)
E
2

I'm not a programmer. I'm not a physician. I'm just a musician who has two eyes (as any human being has).

So... I know the electromagnetic waves have a logarythm scale pattern into the Radio and TV range. Why it should be differente in the visible light range?

Inside the Radio and TV world we use a simple equation: We divide a given range between two frecuencies into a given number of parts according to the ratio between the extreme frecuencies.

Let's say: If our range starts in 100 MHZ and ends in 200 MHZ, we have a ratio of 2 (200 is equal to 100 multiplied by 2).

So, if we have to divide that range in 10 equal parts, we have to use this equation:

The first frecuency (100 MHZ) multiplied by the 10th root of 2.

That new value multiplied by the 10th root of 2.

And so and on.

Why we use the 10th root of 2? Simple: Remember it is not a linear scale, it is a logarythm scale (exactly the same of musical notes).

So, based in that equation, as we know the visible light spectrum is between 780 and 380 nanometers (aproximately 384.02 THZ and 789.26 THZ; both values very aproximately, because it is a variable value according to the individual optical capability), we just to know the ratio between those frecuencies:

789.26/384.02=2,055

Also, we know that the RGB aproximately equivalent to that extreme frecuencies are:

384.02 THZ = 95,0,0 (hx=5F0000)

788.92 THZ = 97,0,97 (hx=610061)

Also, we know all the possible RGB combinations between that points are = 1595

So, with all those values we have a simple equation:

RGB = 95, 0, 0 = 384.02 THZ

RGB = 96, 0, 0 = 384.02 THZ multiplied by (1595th root of 2,055) = 384,19 THZ

RGB = 97, 0, 0 = 384,19 THZ multiplied by (1595th root of 2,055) = 384.37 THZ

And so and on

Simple scale.

Just my humble opinion.

Entremets answered 14/5, 2020 at 4:7 Comment(0)
T
1

VBA code is derived from Approximate "RGB values for Visible Wavelengths" by Dan Bruton ([email protected]). Link to his original Fortran code: http://www.physics.sfasu.edu/astro/color/spectra.html Spectra program: http://www.efg2.com/Lab/ScienceAndEngineering/Spectra.htm

Sub Wavelength_To_RGB()

'Purpose: Loop thru the wavelengths in the visible spectrum of light
'         and output the RGB values and colors to a worksheet.
'         Wavelength range: 380nm and 780nm

Dim j As Long, CellRow As Long
Dim R As Double, G As Double, B As Double
Dim iR As Integer, iG As Integer, iB As Integer
Dim WL As Double
Dim Gamma As Double
Dim SSS As Double


Gamma = 0.8
CellRow = 1

For j = 380 To 780

  WL = j

  Select Case WL

  Case 380 To 440
      R = -(WL - 440#) / (440# - 380#)
      G = 0#
      B = 1#
  Case 440 To 490
      R = 0#
      G = ((WL - 440#) / (490# - 440#))
      B = 1#
  Case 490 To 510
      R = 0#
      G = 1#
      B = (-(WL - 510#) / (510# - 490#))
  Case 510 To 580
      R = ((WL - 510#) / (580# - 510#))
      G = 1#
      B = 0#
  Case 580 To 645
      R = 1#
      G = (-(WL - 645#) / (645# - 580#))
      B = 0#
  Case 645 To 780
      R = 1#
      G = 0#
      B = 0#
  Case Else
      R = 0#
      G = 0#
      B = 0#
  End Select

  'LET THE INTENSITY SSS FALL OFF NEAR THE VISION LIMITS
  If WL > 700 Then
     SSS = 0.3 + 0.7 * (780# - WL) / (780# - 700#)
  ElseIf WL < 420 Then
     SSS = 0.3 + 0.7 * (WL - 380#) / (420# - 380#)
  Else
     SSS = 1#
  End If

  'GAMMA ADJUST
  R = (SSS * R) ^ Gamma
  G = (SSS * G) ^ Gamma
  B = (SSS * B) ^ Gamma

  'Multiply by 255
  R = R * 255
  G = G * 255
  B = B * 255

  'Change RGB data type from Double to Integer.
  iR = CInt(R)
  iG = CInt(G)
  iB = CInt(B)

  'Output to worksheet
  Cells(CellRow, 1).Interior.Color = RGB(iR, iG, iB)
  Cells(CellRow, 2) = WL
  Cells(CellRow, 3) = "(" & iR & "," & iG & "," & iB & ")"
  CellRow = CellRow + 1

Next j


End Sub
Tiaratibbetts answered 15/10, 2015 at 12:19 Comment(0)
M
1

A runnable example based on a popular answer:

function spectrogram() {
  var svgns = 'http://www.w3.org/2000/svg';
  var svg = document.createElementNS(svgns, 'svg');
  var defs = document.createElementNS(svgns, 'defs');
  var gradient = document.createElementNS(svgns, 'linearGradient');
  var rect = document.createElementNS(svgns, 'rect');

  var stops = spectral_gradient( 400, 700, 3 );

  for( var i = 0, length = stops.length; i < length; i++ ) {
    var stop = document.createElementNS(svgns, 'stop');
    stop.setAttribute('offset', stops[i].offset);
    stop.setAttribute('stop-color', stops[i].color);
    gradient.appendChild(stop);
  }

  // Apply the <lineargradient> to <defs>
  gradient.id = 'Gradient';
  gradient.setAttribute('x1', '0');
  gradient.setAttribute('x2', '1');
  gradient.setAttribute('y1', '0');
  gradient.setAttribute('y2', '0');
  defs.appendChild(gradient);

  // Setup the <rect> element.
  rect.setAttribute('fill', 'url(#Gradient)');
  rect.setAttribute('width', '100%');
  rect.setAttribute('height', '100%');

  // Assign an id, classname, width and height
  svg.setAttribute('width', '100%');
  svg.setAttribute('height', '100%')
  svg.setAttribute('version', '1.1');
  svg.setAttribute('xmlns', svgns);

  // Add the <defs> and <rect> elements to <svg>
  svg.appendChild(defs);
  svg.appendChild(rect);

  // Add the <svg> element to <body>
  document.body.appendChild(svg);
}

function spectral_gradient( wl1, wl2, steps ) {
  var stops = [];
  var delta = Math.abs( wl2 - wl1 );

  for( var wl = wl1; wl <= wl2; wl += steps ) {
    var offset = Math.round( (1 - Math.abs( wl2 - wl ) / delta) * 100 );
    stops.push({
      "color": wavelength2hex( wl ),
      "offset": offset + "%"
    });
  }

  return stops;
}

function wavelength2hex( l ) {
  var wl = wavelength2rgb( l );
  var rgb = {
    "r": Math.round( wl.r * 255 ),
    "g": Math.round( wl.g * 255 ),
    "b": Math.round( wl.b * 255 )
  };

  return rgb2hex( rgb.r, rgb.g, rgb.b );
}

function wavelength2rgb( l ) {
  var t;
  var r = 0.0;
  var g = 0.0;
  var b = 0.0;

  if ((l >= 400.0) && (l < 410.0)) {
    t = (l - 400.0) / (410.0 - 400.0);
    r = +(0.33 * t) - (0.20 * t * t);
  } else if ((l >= 410.0) && (l < 475.0)) {
    t = (l - 410.0) / (475.0 - 410.0);
    r = 0.14 - (0.13 * t * t);
  } else if ((l >= 545.0) && (l < 595.0)) {
    t = (l - 545.0) / (595.0 - 545.0);
    r = +(1.98 * t) - (t * t);
  } else if ((l >= 595.0) && (l < 650.0)) {
    t = (l - 595.0) / (650.0 - 595.0);
    r = 0.98 + (0.06 * t) - (0.40 * t * t);
  } else if ((l >= 650.0) && (l < 700.0)) {
    t = (l - 650.0) / (700.0 - 650.0);
    r = 0.65 - (0.84 * t) + (0.20 * t * t);
  }

  if ((l >= 415.0) && (l < 475.0)) {
    t = (l - 415.0) / (475.0 - 415.0);
    g = +(0.80 * t * t);
  } else if ((l >= 475.0) && (l < 590.0)) {
    t = (l - 475.0) / (590.0 - 475.0);
    g = 0.8 + (0.76 * t) - (0.80 * t * t);
  } else if ((l >= 585.0) && (l < 639.0)) {
    t = (l - 585.0) / (639.0 - 585.0);
    g = 0.84 - (0.84 * t);
  }

  if ((l >= 400.0) && (l < 475.0)) {
    t = (l - 400.0) / (475.0 - 400.0);
    b = +(2.20 * t) - (1.50 * t * t);
  } else if ((l >= 475.0) && (l < 560.0)) {
    t = (l - 475.0) / (560.0 - 475.0);
    b = 0.7 - (t) + (0.30 * t * t);
  }

  return {"r": r, "g": g, "b": b};
}

function rgb2hex( r, g, b ) {
  return "#" + hex( r ) + hex( g ) + hex( b );
}

function hex( v ) {
  return v.toString( 16 ).padStart( 2, "0" );
}
<!DOCTYPE html>
<html lang="en">
<head>
  <meta charset="utf-8" />
  <script src="js/spectrum.js"></script>
</head>
<body onload="spectrogram();">
</body>
</html>
Maratha answered 19/10, 2019 at 23:43 Comment(0)
O
1

I found Spektre's answer useful, in that many people won't be in a position to apply the rigorous CIE-based methodology from other answers, but would still like a ready-to-run solution with some basis in physical reality.

To that end, I made a revised algorithm by fitting Spektre's data with a B-spline of degree 2 using wavelength as the parameter. This has the advantage that the RGB color varies smoothly with wavelength (it has a continuous first derivative), and is a bit simpler since most of the calculation has been done in advance. This form is also amenable to vector (SIMD) processing, where that is relevant.

Plot of RGB curves fitted to Spektre's data

In Javascript:

function wavelengthToRGB (λ) {
    const C=[
        350,
            3.08919e-5,-2.16243e-2, 3.78425e+0,
            0.00000e+0, 0.00000e+0, 0.00000e+0,
            4.33926e-5,-3.03748e-2, 5.31559e+0,
        397,
           -5.53952e-5, 4.68877e-2,-9.81537e+0,
            6.13203e-5,-4.86883e-2, 9.66463e+0,
            4.41410e-4,-3.46401e-1, 6.80468e+1,
        423,
           -3.09111e-5, 2.61741e-2,-5.43445e+0,
            1.85633e-4,-1.53857e-1, 3.19077e+1,
           -4.58520e-4, 4.14940e-1,-9.29768e+1,
        464,
            2.86786e-5,-2.91252e-2, 7.39499e+0,
           -1.66581e-4, 1.72997e-1,-4.39224e+1,
            4.37994e-7,-1.09728e-2, 5.83495e+0,
        514,
            2.06226e-4,-2.11644e-1, 5.43024e+1,
           -6.65652e-5, 7.01815e-2,-1.74987e+1,
            9.41471e-5,-1.07306e-1, 3.05925e+1,
        565,
           -2.78514e-4, 3.36113e-1,-1.00439e+2,
           -1.79851e-4, 1.98194e-1,-5.36623e+1,
            1.12142e-5,-1.35916e-2, 4.11826e+0,
        606,
           -1.44403e-4, 1.73570e-1,-5.11884e+1,
            2.47312e-4,-3.19527e-1, 1.03207e+2,
            0.00000e+0, 0.00000e+0, 0.00000e+0,
        646,
            6.24947e-5,-9.37420e-2, 3.51532e+1,
            0.00000e+0, 0.00000e+0, 0.00000e+0,
            0.00000e+0, 0.00000e+0, 0.00000e+0,
        750
    ];
    let [r,g,b] = [0,0,0];
    if (λ >= C[0] && λ < C[C.length-1]) {
        for (let i=0; i<C.length; i+=10) {
            if (λ < C[i+10]) {
                const λ2 = λ*λ;
                r = C[i+1]*λ2 + C[i+2]*λ + C[i+3];
                g = C[i+4]*λ2 + C[i+5]*λ + C[i+6];
                b = C[i+7]*λ2 + C[i+8]*λ + C[i+9];
                break;
            }
        }
    }
    return [r,g,b];
}

The array in this function contains the bounding wavelengths for each span (in nm), and between each boundary there are three sets of λ², λ¹ and λ⁰ coefficients – one each for red, green and blue.

If you want to use different units, you can convert the boundary values accordingly (but reverse the search order if you are using reciprocal units, e.g. THz, eV or cm-1).

You can also premultiply all the coefficients by 255 (and cast to int) if you want to generate 8-bit color components directly.
Odaniel answered 13/3, 2023 at 21:28 Comment(2)
This can generate RGB values greater than 1 and less than 0. Which would seem to be out of bounds. Try out 506 and 524 for example.Floret
@AnthonyMichaelCook good catch – I've edited the code to correct this. It should now return values in [0,1] for all λ (with values clamped to zero outside the range [350,750])Odaniel

© 2022 - 2024 — McMap. All rights reserved.